Español
Free, no sign-up

Companion figures

All 256 charts and maps from the six books, in full color and numbered as they are in the book, free for every reader and every listener, whichever edition you have. Tap a figure to see it in full.

The Economics of Mexico

68 figures. See the book

Two stacked charts. Top, log-scale inflation from 1980 to 2025: December-on-December 159.2 percent in 1987 and 52.0 in 1995, the annual average 3.8 in 2025, with Banxico's 3 percent target from 2003. Bottom, Mexico's GDP per person as a percent of the United States': Penn World Table 42.0 in 1980 an
The puzzle in one pictureFigure 1.1Sources: World Bank, World Development Indicators (read July 13 and October 14, 2026); INEGI data compiled by CEFP (2018 and 2026 tables); Banco de México; Penn World Table via FRED (1950 to 2000); World Bank, GDP per person, PPP, constant 2021 international dollars (read October 8, 2026).
Bar chart of Mexico's real GDP growth every year from 1970 to 2025, among them 6.5 percent in 1970, 8.8 in 1980, 9.6 in 1981, minus 0.05 in 1982, minus 4.6 in 1983, minus 3.9 in 1986, minus 5.9 in 1995, minus 6.3 in 2009, minus 8.7 in 2020, 5.8 in 2021, 3.1 in 2023, 1.4 in 2024 and 0.5 in 2025; diam
Growth and its breaks, 1970 to 2025Figure 2.1Sources: World Bank, World Development Indicators (read October 14, 2026), for 1970 to 2019 and 2022; INEGI, 2018-base national accounts, August 29, 2023, for 2020 and 2021; OECD via FRED for 2023; INEGI for 2024 and 2025; inflation: INEGI data compiled by CEFP (2018); the full run of inflation is in Figure 2.3.
Line chart of Mexico's external debt every year from 1970 to 1995, labeled at 7.1 billion dollars in 1970, 57.6 in 1980, 78.4 in 1981, 86.3 in 1982, 139.9 in 1994 and 166.7 in 1995, with the August 1982 default, the 1989 to 1994 Brady Plan and the December 1994 devaluation marked.
The debt that broke the old model, 1970 to 1995Figure 2.2Source: World Bank, International Debt Statistics via World Development Indicators; events from the chapter's cards.
Log-scale line chart of Mexico's inflation every year from 1980 to 2024, labeled at the World Bank annual averages of 58.9 percent in 1982, 101.9 in 1983, 131.8 in 1987, 35.0 in 1995 and 4.7 in 2024; diamonds for December-to-December rates every year from 1980 to 2000, labeled at 98.8 percent in 198
Inflation from crisis to target, 1980 to 2024Figure 2.3Sources: World Bank, World Development Indicators (read July 13 and October 14, 2026); INEGI data compiled by CEFP (2018); Banco de México; El Financiero, March 15, 2022.
Four small bar charts. Minimum wage: 88.36 pesos a day in 2018 and 315.04 in 2026. Poverty: 41.9 percent in 2018, 43.9 in 2020, 36.3 in 2022 and 29.6 in 2024. Deficit: 5.7 percent of GDP in 2024 and 4.9 in 2025. Public debt: 52.0 percent of GDP in 2024, 52.6 in 2025, 54.0 estimated for 2026 and 55.0
The turn of 2018 to 2026 in four measuresFigure 2.4Sources: CONASAMI, as reported by ContadorMx (2018) and EY Mexico (2026); CONEVAL, August 5, 2021; INEGI, Pobreza multidimensional 2024, August 13, 2025; SHCP via press (2024 deficit, October 27, 2025); Ecosistema Startup, September 1, 2026; SHCP, January 30, 2026, and Criterios Generales de Política Económica 2027, September 8, 2026.
Three panels. Birth rate per 1,000 people: Mexico 28.7 in 1992 and 15.5 in 2024, the United States 10.6 in 2024. Fertility: from 3.29 children per woman in 1992 down to 1.89 in 2024 (World Bank and CONAPO), CONAPO's projection 1.54 in 2070, below the replacement line of 2.1. Births in 2025: Mexico 1
Fewer births, 1992 to 2025Figure 3.2Sources: World Bank, World Development Indicators, data for 1992 and 2024; CONAPO, projections 2020 to 2070, as presented by CESNIDS, December 7, 2023; INEGI, registered births 2025 (September 25, 2026); CDC, NCHS, final births 2025, Data Brief 571 (October 21, 2026).
Points chart of Mexico's population in millions: INEGI counts of 126.0 in 2020 and 130.9 in 2025; CONAPO's projection of 132.3 in 2024, 133.4 in 2025, 138.0 in 2030, 144.5 in 2040, a peak of about 147 in 2053 and 141.4 in 2070; a line at 2034 marks the year people aged 60 and over equal those aged 0
Mexico's population to 2070Figure 3.3Sources: INEGI, 2020 census (January 25, 2021) and Encuesta Intercensal 2025 (September 22, 2026); CONAPO, Proyecciones de la Población de México 2020-2070, as presented by CESNIDS to the SNIEG, December 7, 2023, and as relayed by the press for 2025, 2030 and 2040.
Left: bars for the share of adults 25 and over with at least a bachelor's degree, Mexico 16.0 percent in 2018, 17.0 in 2022 and 18.4 in 2024, the United States 39.1 in 2024. Right: grouped bars of PISA 2025 scores; mathematics Mexico 388, USA 463, OECD 463; reading Mexico 408, USA 490, OECD 461; sci
Schooling and skills, Mexico and the United StatesFigure 3.4Sources: World Bank, World Development Indicators (read July 13, 2026); OECD, PISA 2025 results; OECD, PISA 2022 results (as reported March 2024).
Left: bars of average quarterly household income by decile in 2024, in pesos: 16,795; 28,297; 36,845; 45,245; 54,308; 64,600; 77,451; 95,291; 123,712; and 236,095 for the top tenth. Right: the ratio of top to bottom decile, 20.1 in 2016, 18.3 in 2018, 16.4 in 2020, 15.0 in 2022 and 14.1 in 2024.
Who has the money, 2024Figure 3.5Source: INEGI, Encuesta Nacional de Ingresos y Gastos de los Hogares (ENIGH) 2024, July 2025, and its comparison with earlier rounds (August 13, 2025).
Map of Mexico's 32 states shaded in five steps by the share of people in multidimensional poverty in 2024, from 9.9 percent in Baja California to 66.0 percent in Chiapas; the south is darkest, the north lightest; national 29.6 percent.
Multidimensional poverty by state, 2024Map 3.1Source: INEGI, Pobreza multidimensional 2024 (ENIGH 2024), published August 13, 2025; 2022 comparison as reported by Uno TV.
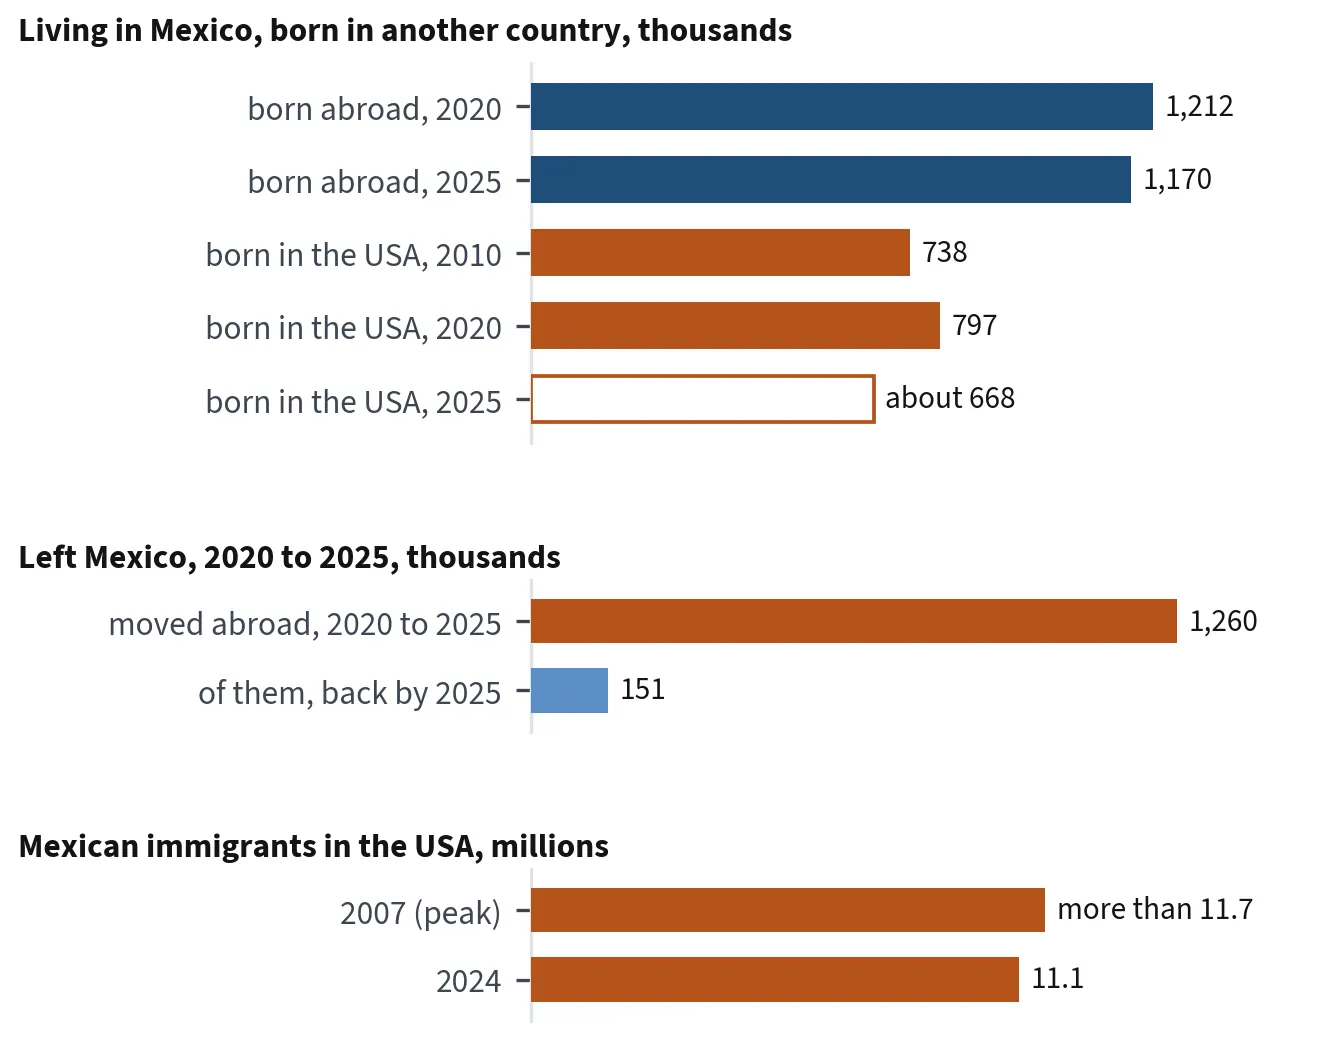
Three bar panels. Living in Mexico, born abroad: 1,212,252 in 2020 and 1,170,030 in 2025; of them born in the United States: 738,103 in 2010, 797,266 in 2020 and about 668,000 in 2025. Left Mexico between 2020 and 2025: 1,259,978 people, of whom 150,752 had returned by 2025. Mexican immigrants livin
Migration both ways, 2007 to 2025Figure 3.6Sources: INEGI, censuses of 2010 and 2020 and Encuesta Intercensal 2025 (press release of September 22, 2026); USA Census Bureau figures as reported, July 16, 2026.
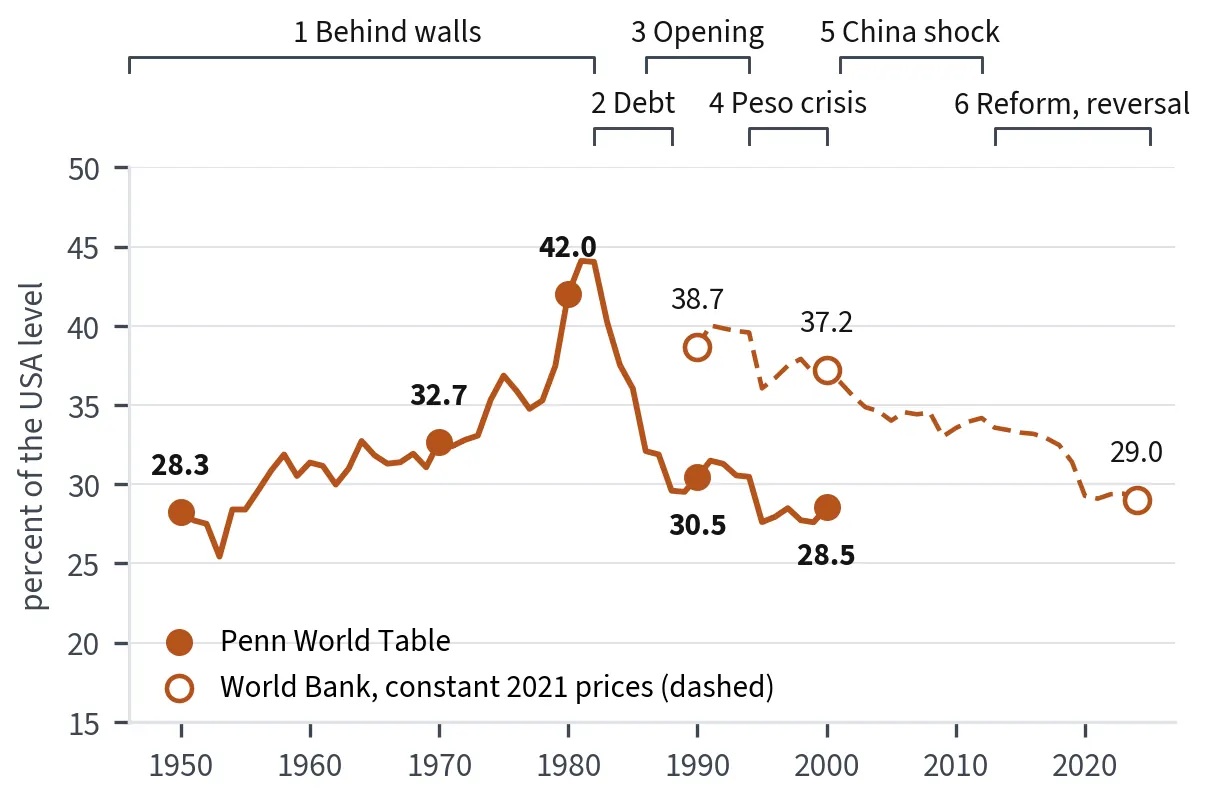
Line chart of Mexico's GDP per person as a percent of the United States', every year: Penn World Table 28.3 in 1950, a peak of 44.1 in 1981, 32.7 in 1970, 42.0 in 1980, 30.5 in 1990 and 28.5 in 2000; World Bank 38.7 in 1990, 37.2 in 2000 and 29.0 in 2024; a strip above marks the six turns.
Mexico against the United States, 1950 to 2024Figure 4.1Sources: Penn World Table via FRED (1950 to 2000), single academic source; World Bank, World Development Indicators, GDP per person, PPP, constant 2021 international dollars (read October 8, 2026).
Horizontal bars of value added in the fourth quarter of 2025: manufacturing 20.3 percent, retail trade 10.7, wholesale trade 9.5, construction 7.1, agriculture 4.5, mining 2.9, electricity, water and gas 1.5 and other services 43.5. Below, one bar divided into agriculture 4.0, industry 32.6 and serv
What Mexico producesFigure 4.2Source: INEGI, national accounts, fourth quarter of 2025 (February 23, 2026) and second quarter of 2026.
Left: bars of Mexico's real GDP growth every year from 1970 to 2025, among them 6.5 percent in 1970, 8.8 in 1980, 9.6 in 1981, minus 0.05 in 1982, minus 4.6 in 1983, minus 3.9 in 1986, minus 5.9 in 1995, minus 6.3 in 2009, minus 8.7 in 2020, 5.8 in 2021, 3.1 in 2023, 1.4 in 2024 and 0.5 in 2025, and
Growth, 1970 to 2025, and the forecasts to 2028Figure 4.3Sources: World Bank, World Development Indicators (1970 to 2019 and 2022, read October 14, 2026); INEGI, 2018-base national accounts, August 29, 2023 (2020, 2021), and annual GDP (2024, 2025); OECD via FRED (2023); BEA and IMF (USA 2025); Banco de México, expectations surveys, July and September 2026; IMF; World Bank; OECD.
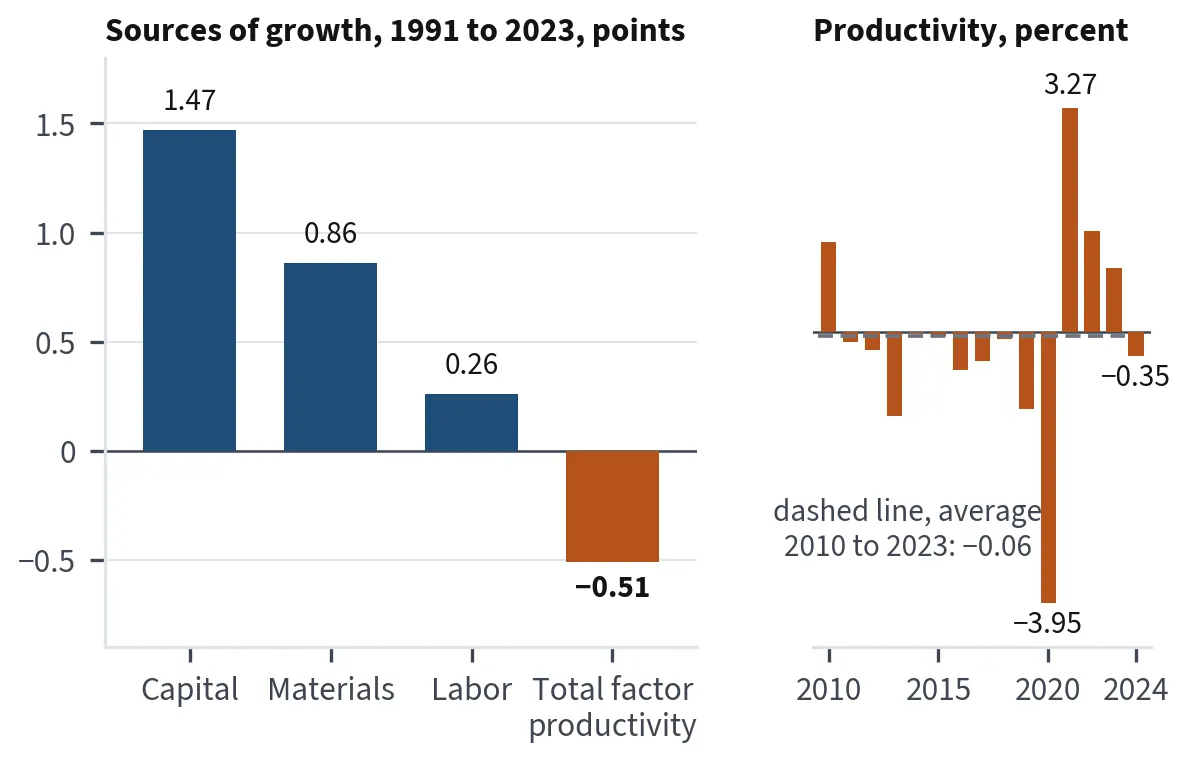
Left: bars of average contributions to growth, 1991 to 2023: capital 1.47 percentage points, materials 0.86, labor 0.26, total factor productivity minus 0.51. Right: total factor productivity each year from 2010 to 2024, falling in most years to 2020 (minus 3.95 in 2020), then rising 3.27 percent in
Where growth came from, 1991 to 2024Figure 4.4Source: INEGI, Productividad Total de los Factores, modelo KLEMS, release of December 20, 2024; 2024 via press.
Horizontal bars of domestic credit to the private sector as a percent of GDP: Mexico 35.5 in 2025, Colombia 39.9, Latin America and the Caribbean 52.9, Brazil 75.1, Chile 102.1, the world 140.3 in 2024, OECD members 147.3 in 2024 and the United States 201.3 in 2025.
How little Mexico's banks lend, 2025Figure 4.5Source: World Bank, World Development Indicators, domestic credit to the private sector, data for 2025 (world and OECD members, 2024).
Chart of investment as a percent of GDP: World Bank gross fixed capital formation every year from 2009 to 2025, between about 20 and 24, labeled at 23.7 in 2012, 23.7 in 2016, 20.1 in 2020, 23.3 in 2023, 23.8 in 2024 and 22.4 in 2025; the United States 21.4 in 2024; public investment 5.9 in 2009, 3.
Investment, 2009 to 2030Figure 4.6Sources: World Bank, World Development Indicators (read October 8 and 14, 2026); México ¿cómo vamos?, March 20, 2026; CIEP, April 21, 2026; Plan México as summarized by CIEP; World Bank for the USA, 2024.
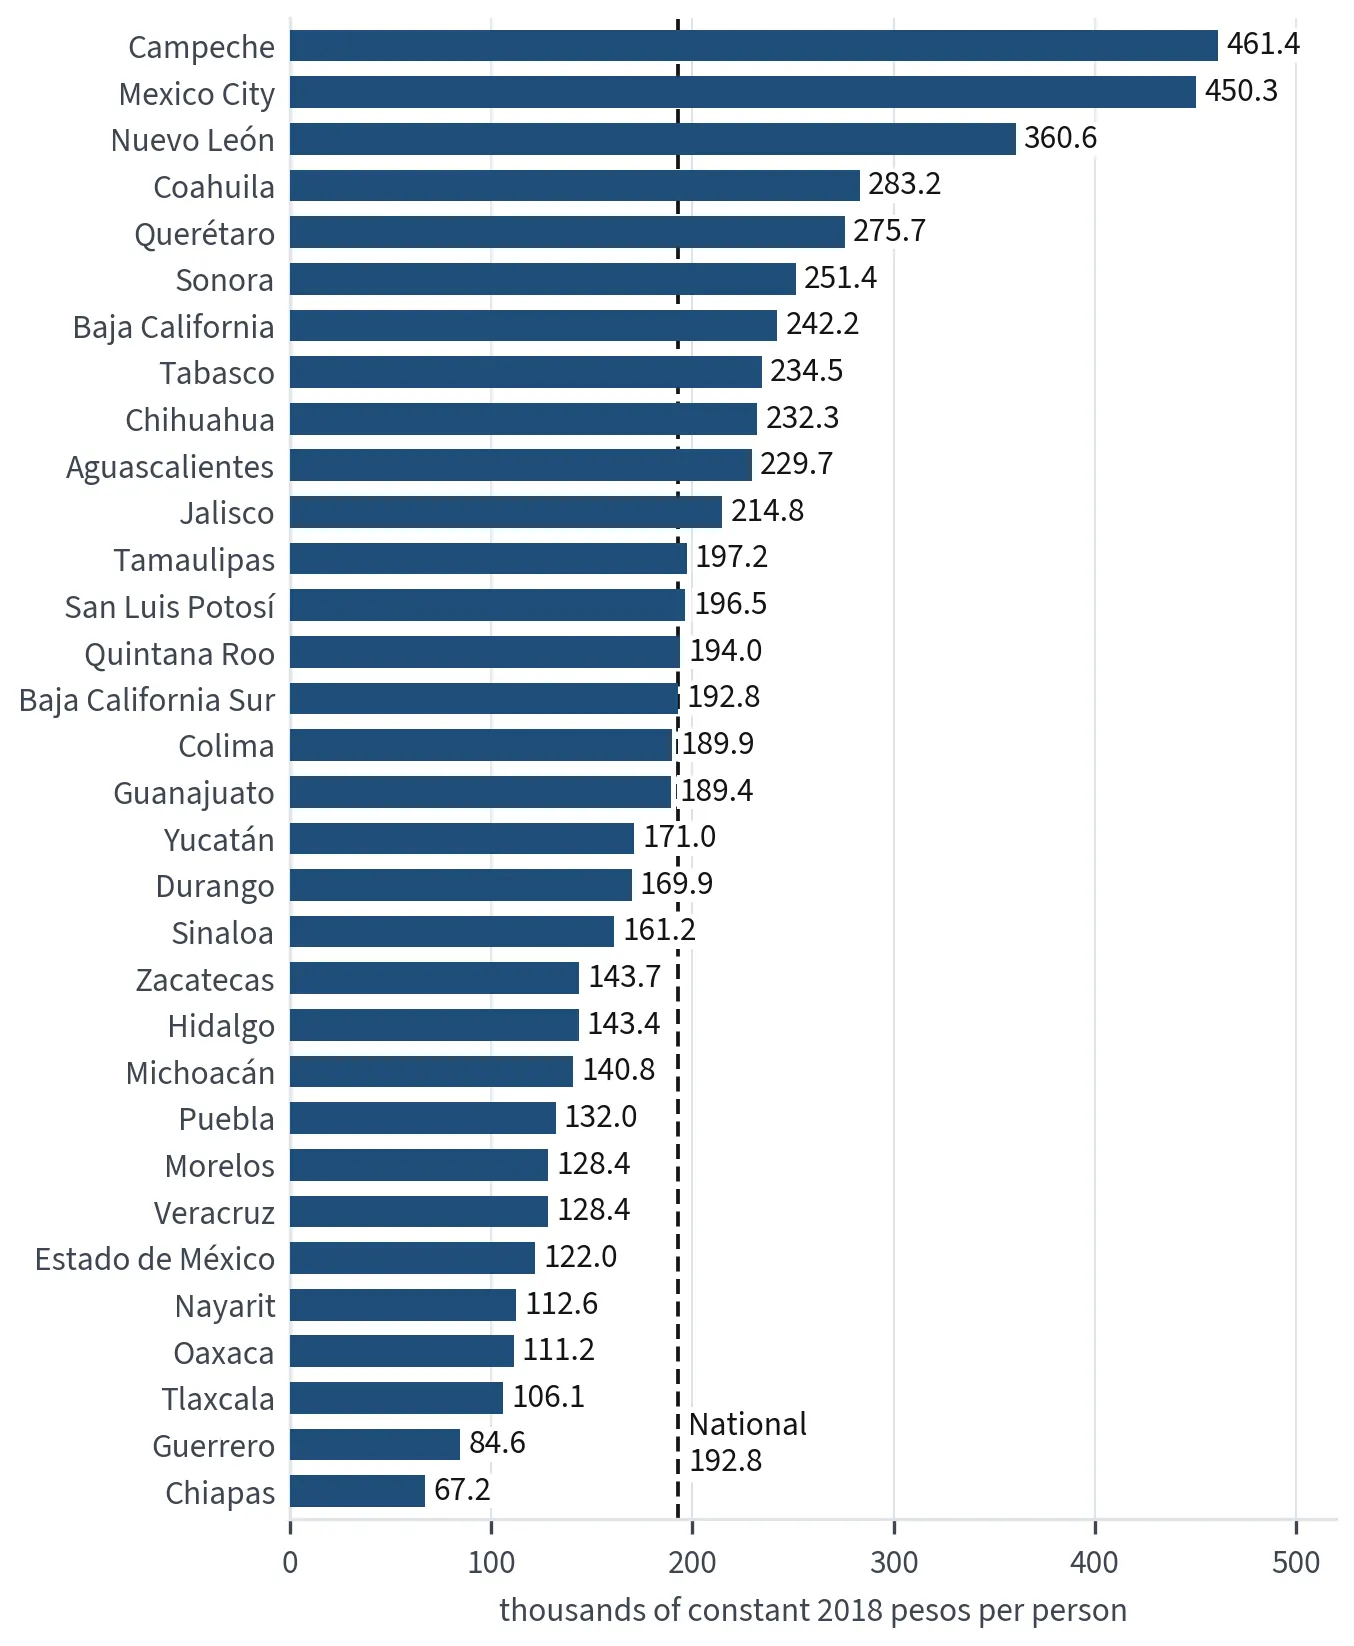
Map of Mexico's 32 states shaded in five steps by GDP per person in 2024, in thousands of constant 2018 pesos: highest in Campeche 461, Mexico City 450, Nuevo León 361, Coahuila 283, Querétaro 276 and Sonora 251; lowest in Chiapas 67, Guerrero 85, Tlaxcala 106, Oaxaca 111 and Nayarit 113; national 1
Two economies on one mapFigure 4.7Sources: CEIEG Chiapas from INEGI and CONAPO (read October 13, 2026); INEGI, state exports bulletin 609/26, September 30, 2026; INEGI, ENOE, second quarter of 2026 (August 25, 2026).
Two panels. Top: Pemex liquids of 1,759 thousand barrels a day in 2024 and 1,635 in 2025, then 1,648 in the fourth quarter of 2025, about 1,652 and 1,658 in the first two quarters of 2026 and 1,656 in July 2026; crude 1,485 in 2024 and 1,367 in 2025 and July 2026; a dashed line marks the 1.8 million
Pemex: production and debt, 2024 to mid-2026Figure 5.1Sources: Pemex, annual results filing of January 27, 2026, fourth-quarter 2025 report of February 27, 2026, communiqué no. 69 of July 31, 2026, July 2026 operating indicators (September 4, 2026) and communiqué no. 48 of December 15, 2025; BBVA Research, August 4, 2026.
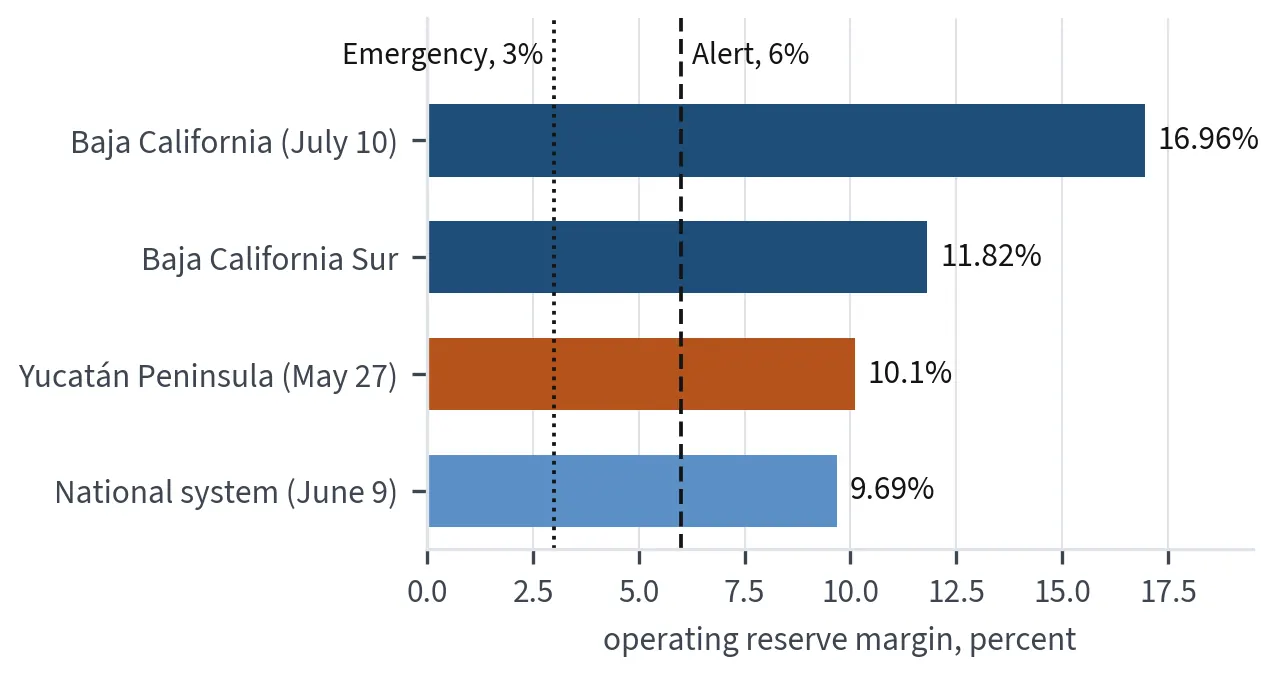
Bars for four readings of the operating reserve margin: under 3 percent on May 7, 2024 (emergency, open bar); 7.38 percent on May 11 and 12, 2024 (alert); 9.69 percent at the national peak of June 9, 2025; 10.1 percent in the Yucatán Peninsula region in 2025. Lines mark the 3 percent emergency and 6
How close the grid has run to its limits, 2024 and 2025Figure 5.3Sources: CENACE, emergency declaration of May 7, 2024 and alert of May 11 and 12, 2024 (reported May 8 and 12, 2024); CFE and CENACE as reported by Crónica, July 14, 2025; SENER statement (bank card of May 20, 2026).
Horizontal bars: Mexico's clean share of generation 24.3 percent in 2023 and 26.0 percent in October 2025; renewable share about 24 percent in 2026; clean share of installed capacity 36.9 percent at the end of 2024; USA renewable share of generation about 24 percent in 2025. Dashed lines mark the 35
Clean electricity against the targetsFigure 5.4Sources: SENER, PRODESEN 2024 to 2038 (June 6, 2024); SENER as reported by IMCO (October 2025 generation; end-2024 capacity); SENER strategy of May 2026 as cited by Revista interAlcaldes; CONCAMIN energy commission (2024); USA Energy Information Administration, 2025 generation.
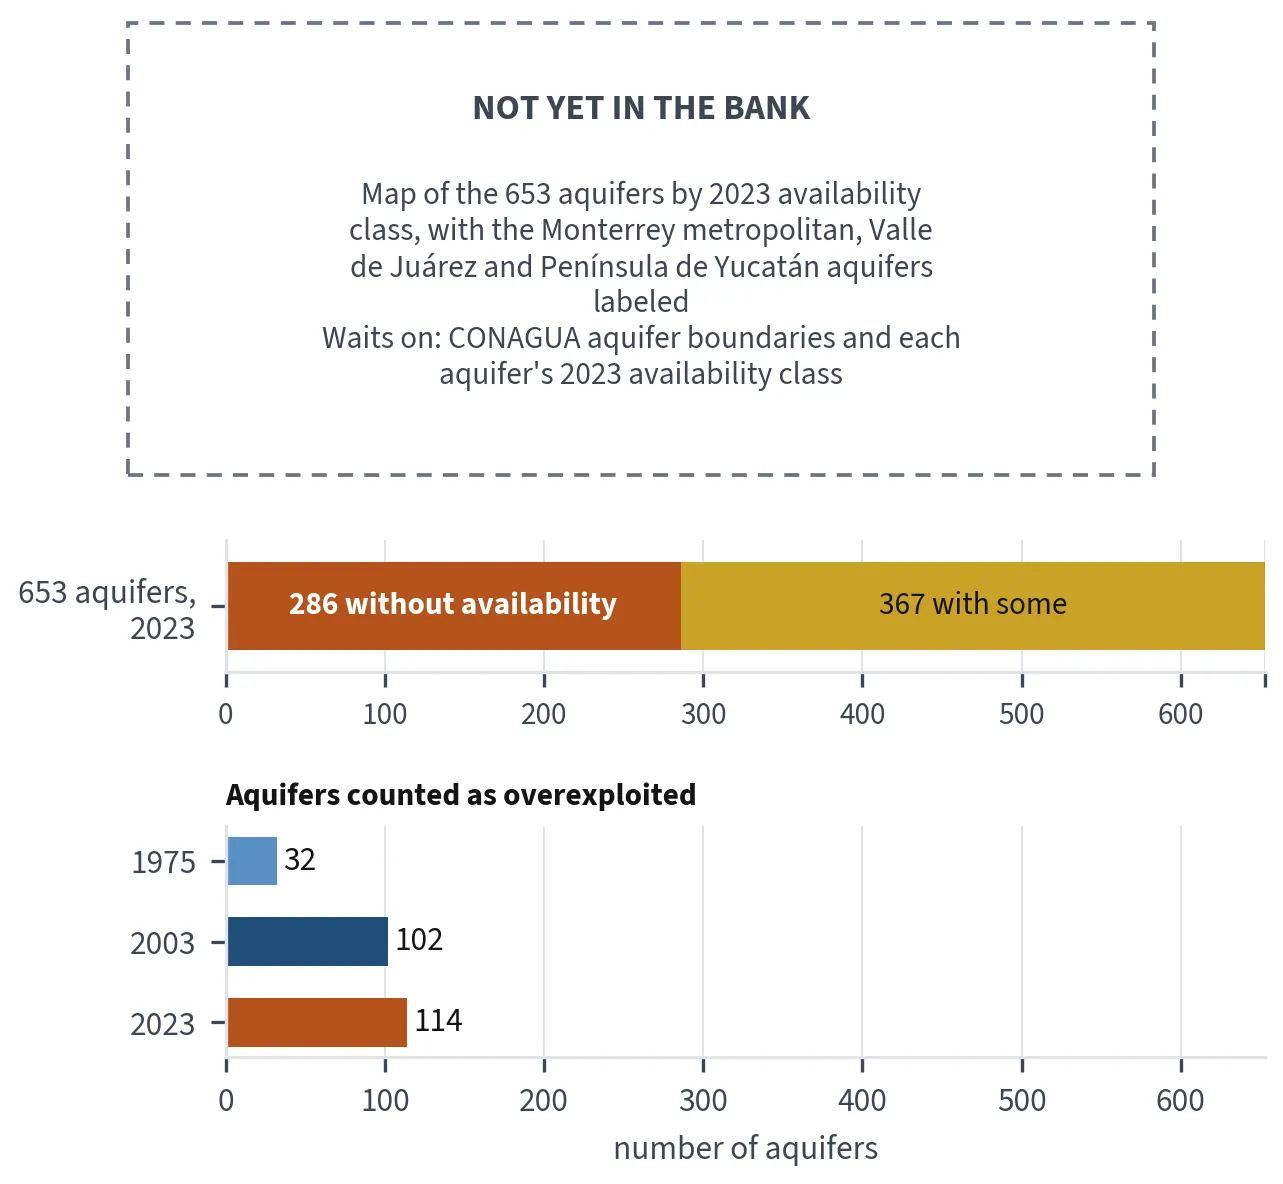
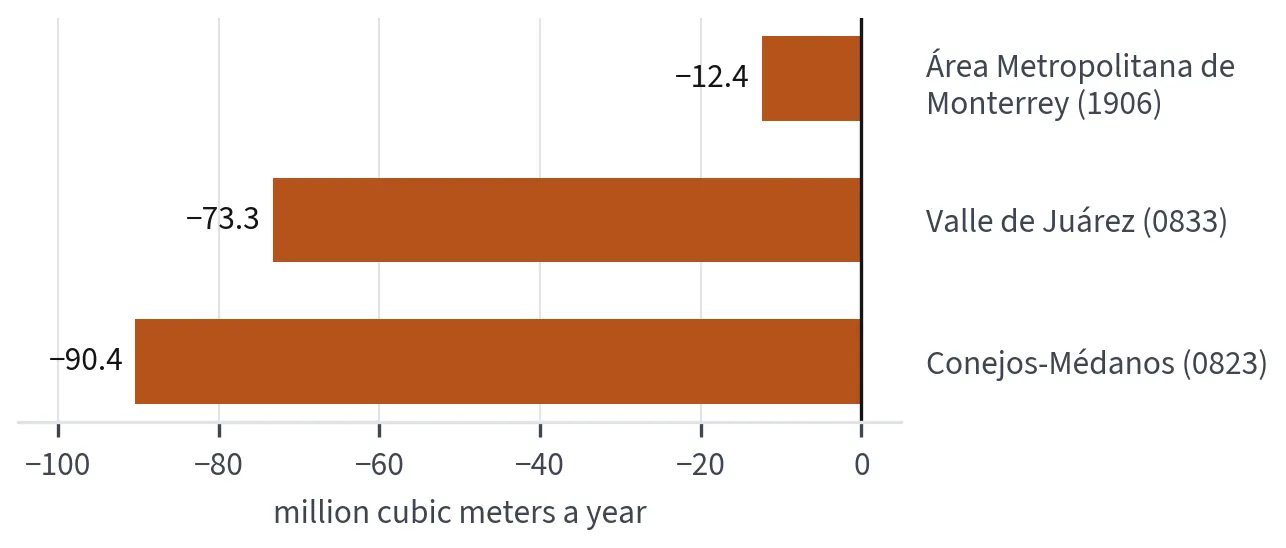
Placeholder frame: the map of Mexico's 653 aquifers shaded by availability class is not yet in the bank; it waits on CONAGUA's aquifer boundaries. Two bar charts. Top: of Mexico's 653 aquifers in 2023, 286 had no availability for new concessions and 367 had some. Bottom: overexploited aquifers numbe
Groundwater by aquifer, 2023Map 5.1Sources: CONAGUA, Acuerdo updating groundwater availability, DOF of November 9, 2023; CONAGUA availability sheet for aquifer 0833 (2024); CONAGUA as reported by Excélsior, March 22, 2024; CONAGUA availability sheet for aquifer 1906 (2024); CONAGUA Acuerdo on aquifer 3105, August 13, 2013.
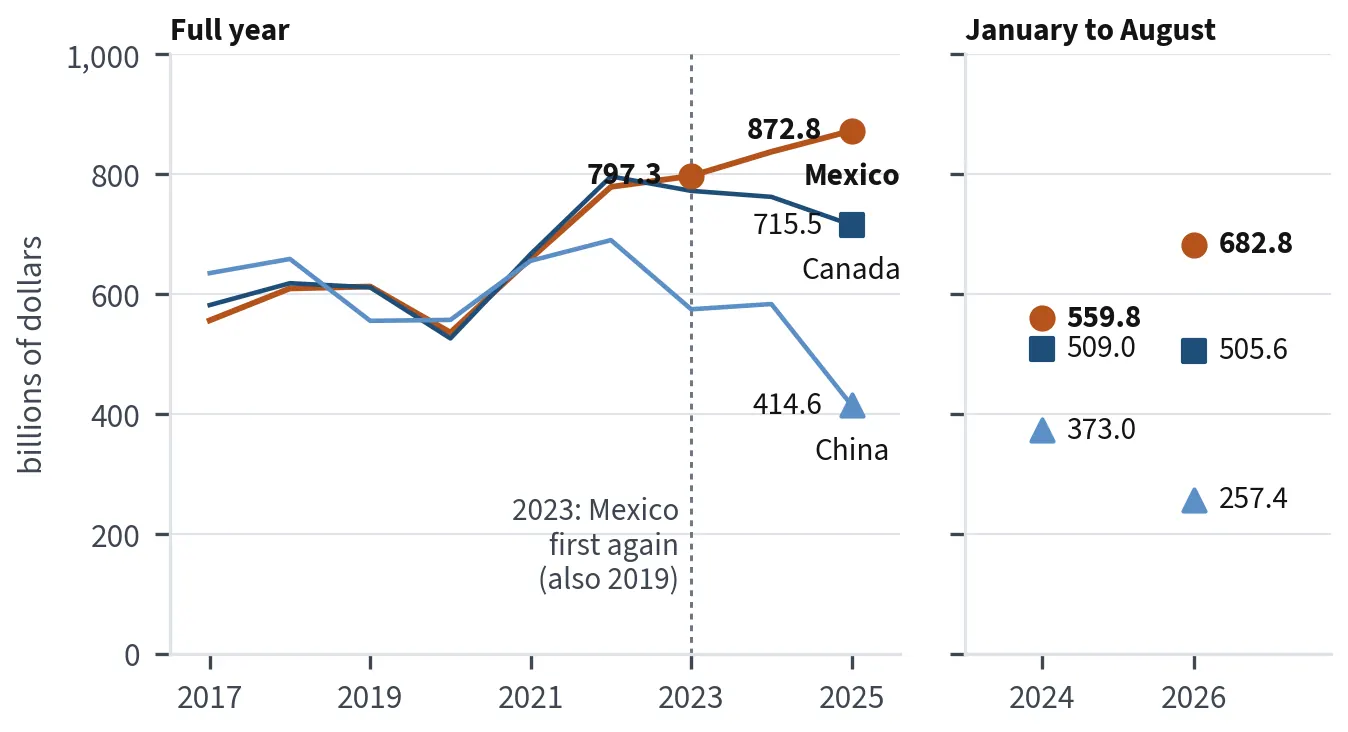
Line chart. Full years from 2017 to 2025: Mexico from about 557 billion dollars in 2017 to 797.3 billion dollars in 2023 and 872.8 in 2025, Canada 715.5 and China 414.6 in 2025; Mexico marked as first partner from 2023. January to August: Mexico 559.8 in 2024 and 682.8 in 2026; Canada 509.0 in 2024
The United States trades most with MexicoFigure 6.1Sources: USA Census Bureau, trade in goods by country (2023, 2025 and January to August 2026, as of October 2026; January to August 2024); Congressional Research Service, August 13, 2026.
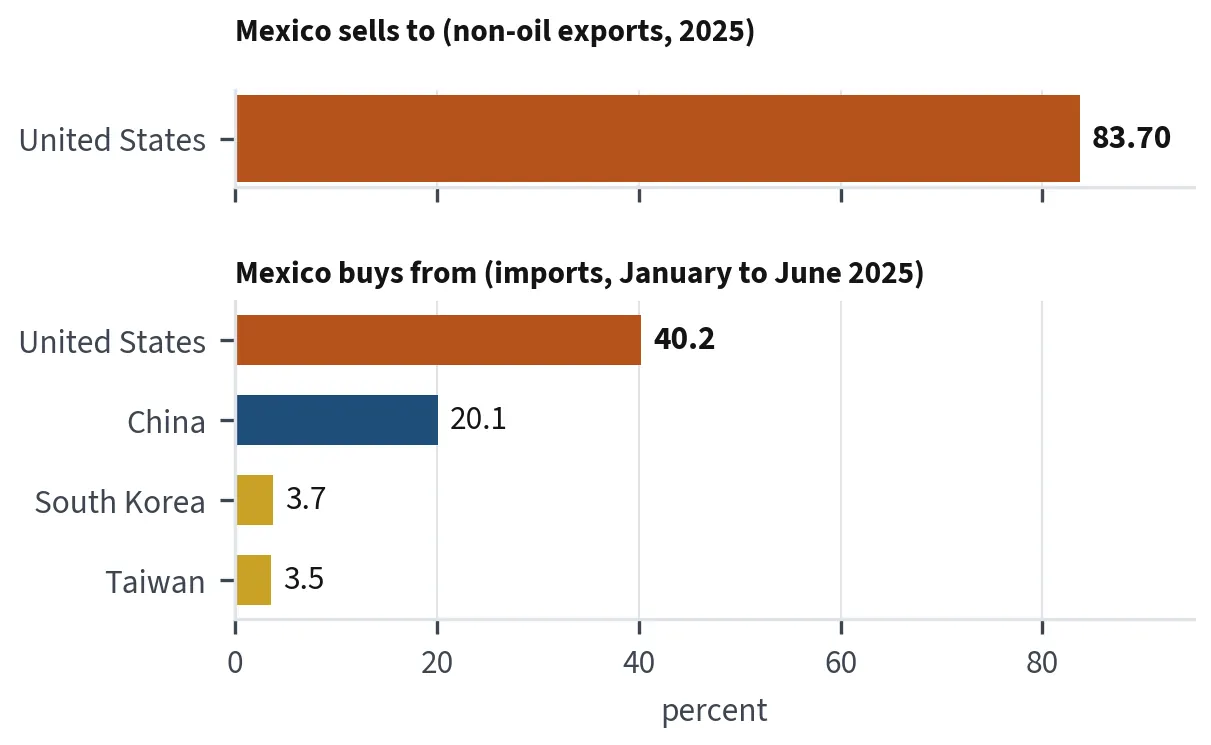
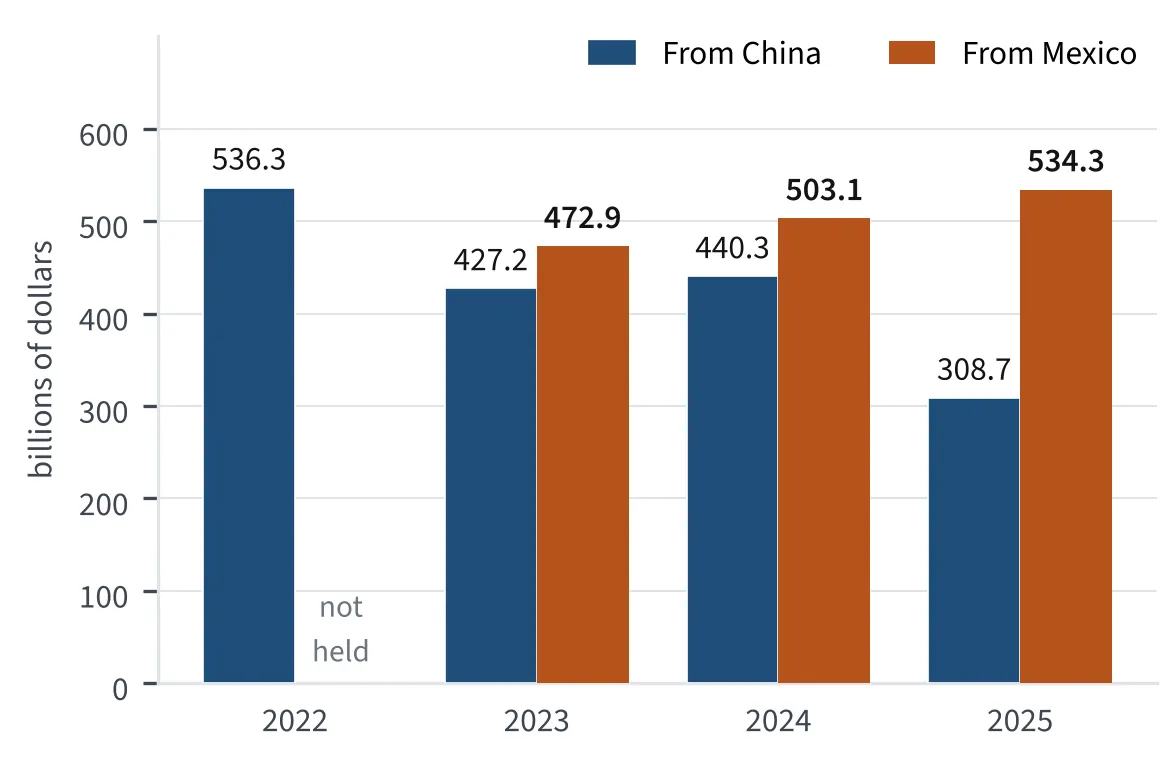
Horizontal bars: the United States took 83.70 percent of Mexico's non-oil exports in 2025; in the first half of 2025 the United States supplied 40.2 percent of Mexico's imports, China 20.1, South Korea 3.7 and Taiwan 3.5.
Where Mexico sells and where it buys, 2025Figure 6.3Sources: Banxico, revised foreign-trade report for December 2025 (February 9, 2026); INEGI, January 27, 2026; BBVA Research reading of INEGI data, September 2025.
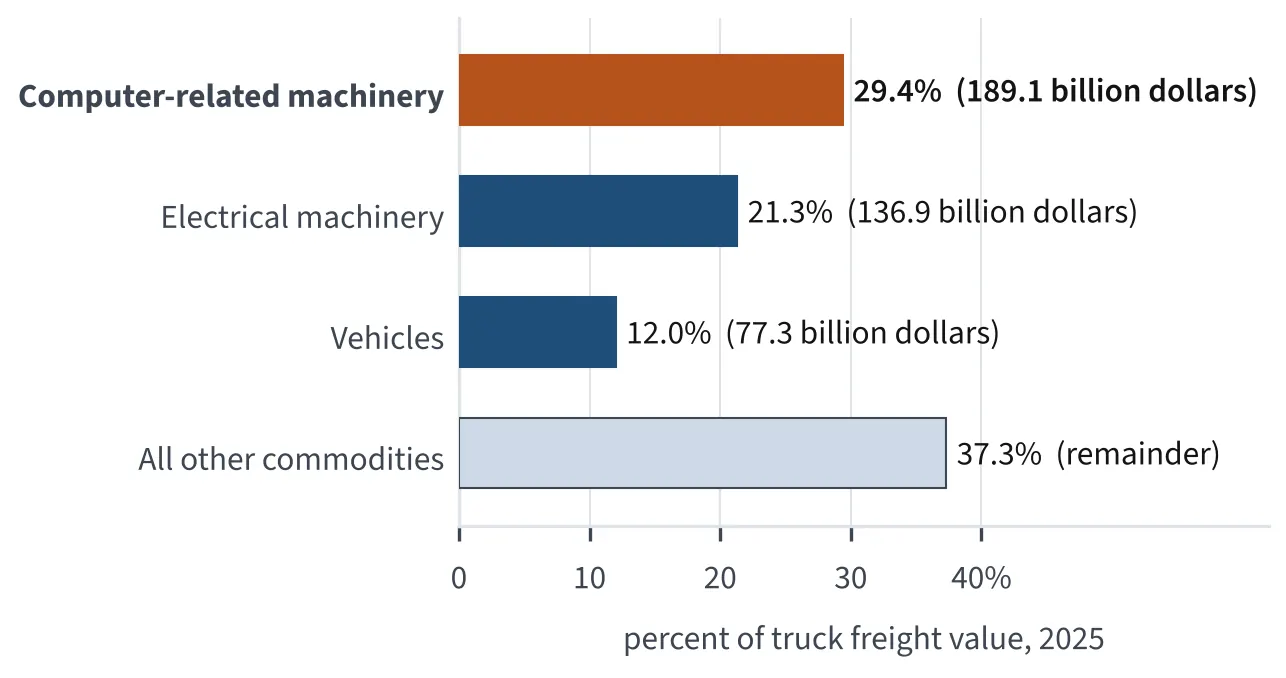
Two bar panels. By mode: truck 642.2 billion dollars (73.6 percent), rail 94.7 (10.9), vessel 67.4 (7.7), air 33.2 (3.8), pipeline 8.4 (1.0). By port: Laredo 296.2 (46.1 percent), Ysleta 112.4 (17.5), Otay Mesa 58.6 (9.1), Hidalgo 40.8 (6.3), Nogales 25.4 (4.0), Eagle Pass 10.2 (1.6).
How freight crosses the border, 2025Figure 6.4Source: USA Bureau of Transportation Statistics, TransBorder Freight Data, 2025 annual (May 15, 2026).
Three bars: about 50 percent of USA imports from Mexico qualified for duty-free USMCA treatment before 2025, about 80 percent by July 2025 and 88 percent in January to May 2026.
The treaty became the line between paying and not payingFigure 6.5Sources: Federal Reserve Bank of Dallas, August 4, 2026; Congressional Research Service, updated August 13, 2026.
Horizontal bars: remittances of 64,746 million dollars in 2024, 62,472 million in 2025 and 36,349 million in January to July 2026, against oil exports of 21,245.5 million in 2025.
Remittances against oilFigure 6.6Sources: Banxico, remittance inflows (February 3, 2026, September 1, 2026, and October 1, 2026, with 2025 revised); INEGI, foreign-trade balance, January 27, 2026.
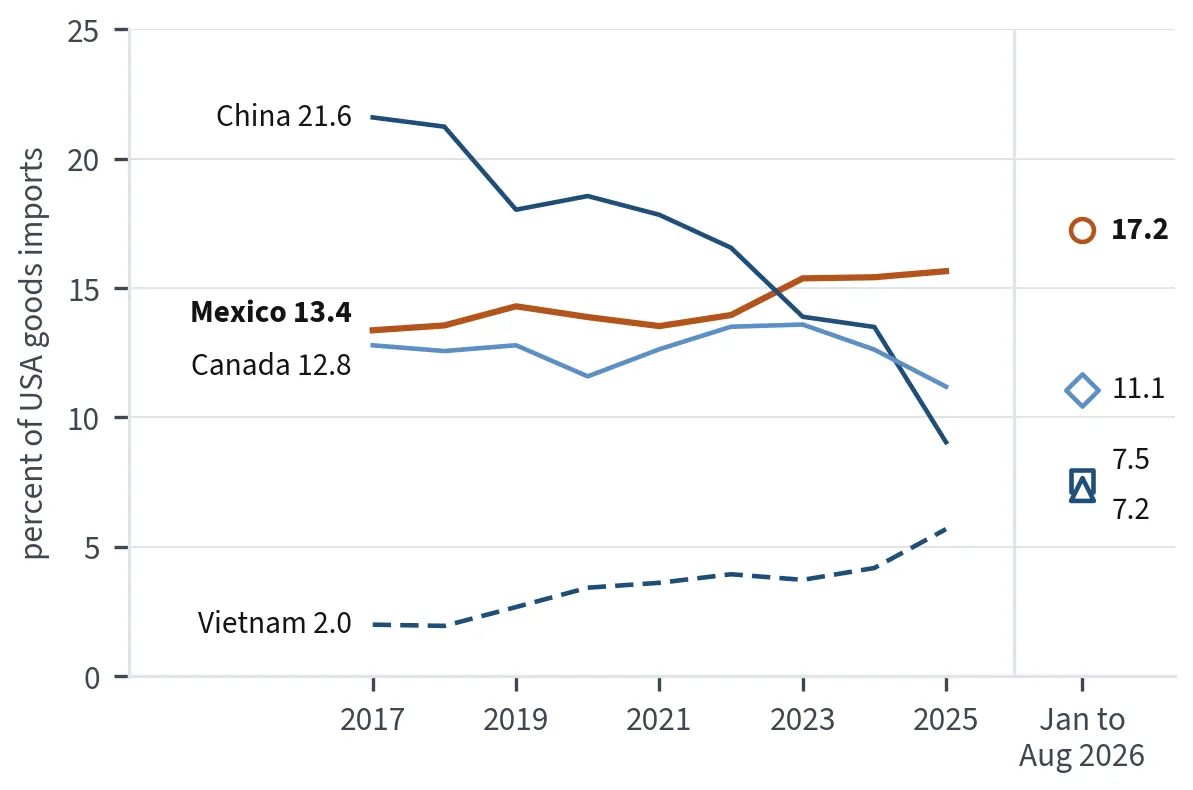
Line chart of shares of USA goods imports, 2017 to 2025, with January to August 2026. Mexico: 13.4 percent in 2017, 15.4 in 2023, 15.6 in 2025 and 17.2 in 2026 so far. China: 21.6 in 2017, 13.9 in 2023, 9.0 in 2025 and 7.5 in 2026 so far. Canada: 12.8 in 2017, 11.2 in 2025 and 11.1 in 2026 so far. V
Who sells to the United States, 2017 to 2026Figure 7.1Sources: USA Census Bureau, trade in goods by country, annual 2017 to 2025 and January to August 2026 (read October 14, 2026; our arithmetic); Federal Reserve Bank of Dallas, December 5, 2024; Inter-American Development Bank, Technical Note IDB-TN-3130, April 2025.
Horizontal bars of 2025 FDI by state: Mexico City 22,381 million dollars (54.8 percent), Nuevo León 3,628 (8.9), Estado de México 3,279 (8.0), Baja California 1,892 (4.6), Baja California Sur 1,578 (3.9), Coahuila 1,307 (3.2), Jalisco 1,256 (3.1), Chihuahua 1,066 (2.6), Quintana Roo 1,064 (2.6), Gua
Where foreign investment is counted, 2025Figure 7.3Sources: Secretaría de Economía, FDI by state, 2025 (data to December 31, 2025) and Q2 2026 report (September 29, 2026); Cluster Industrial, May 4, 2026.
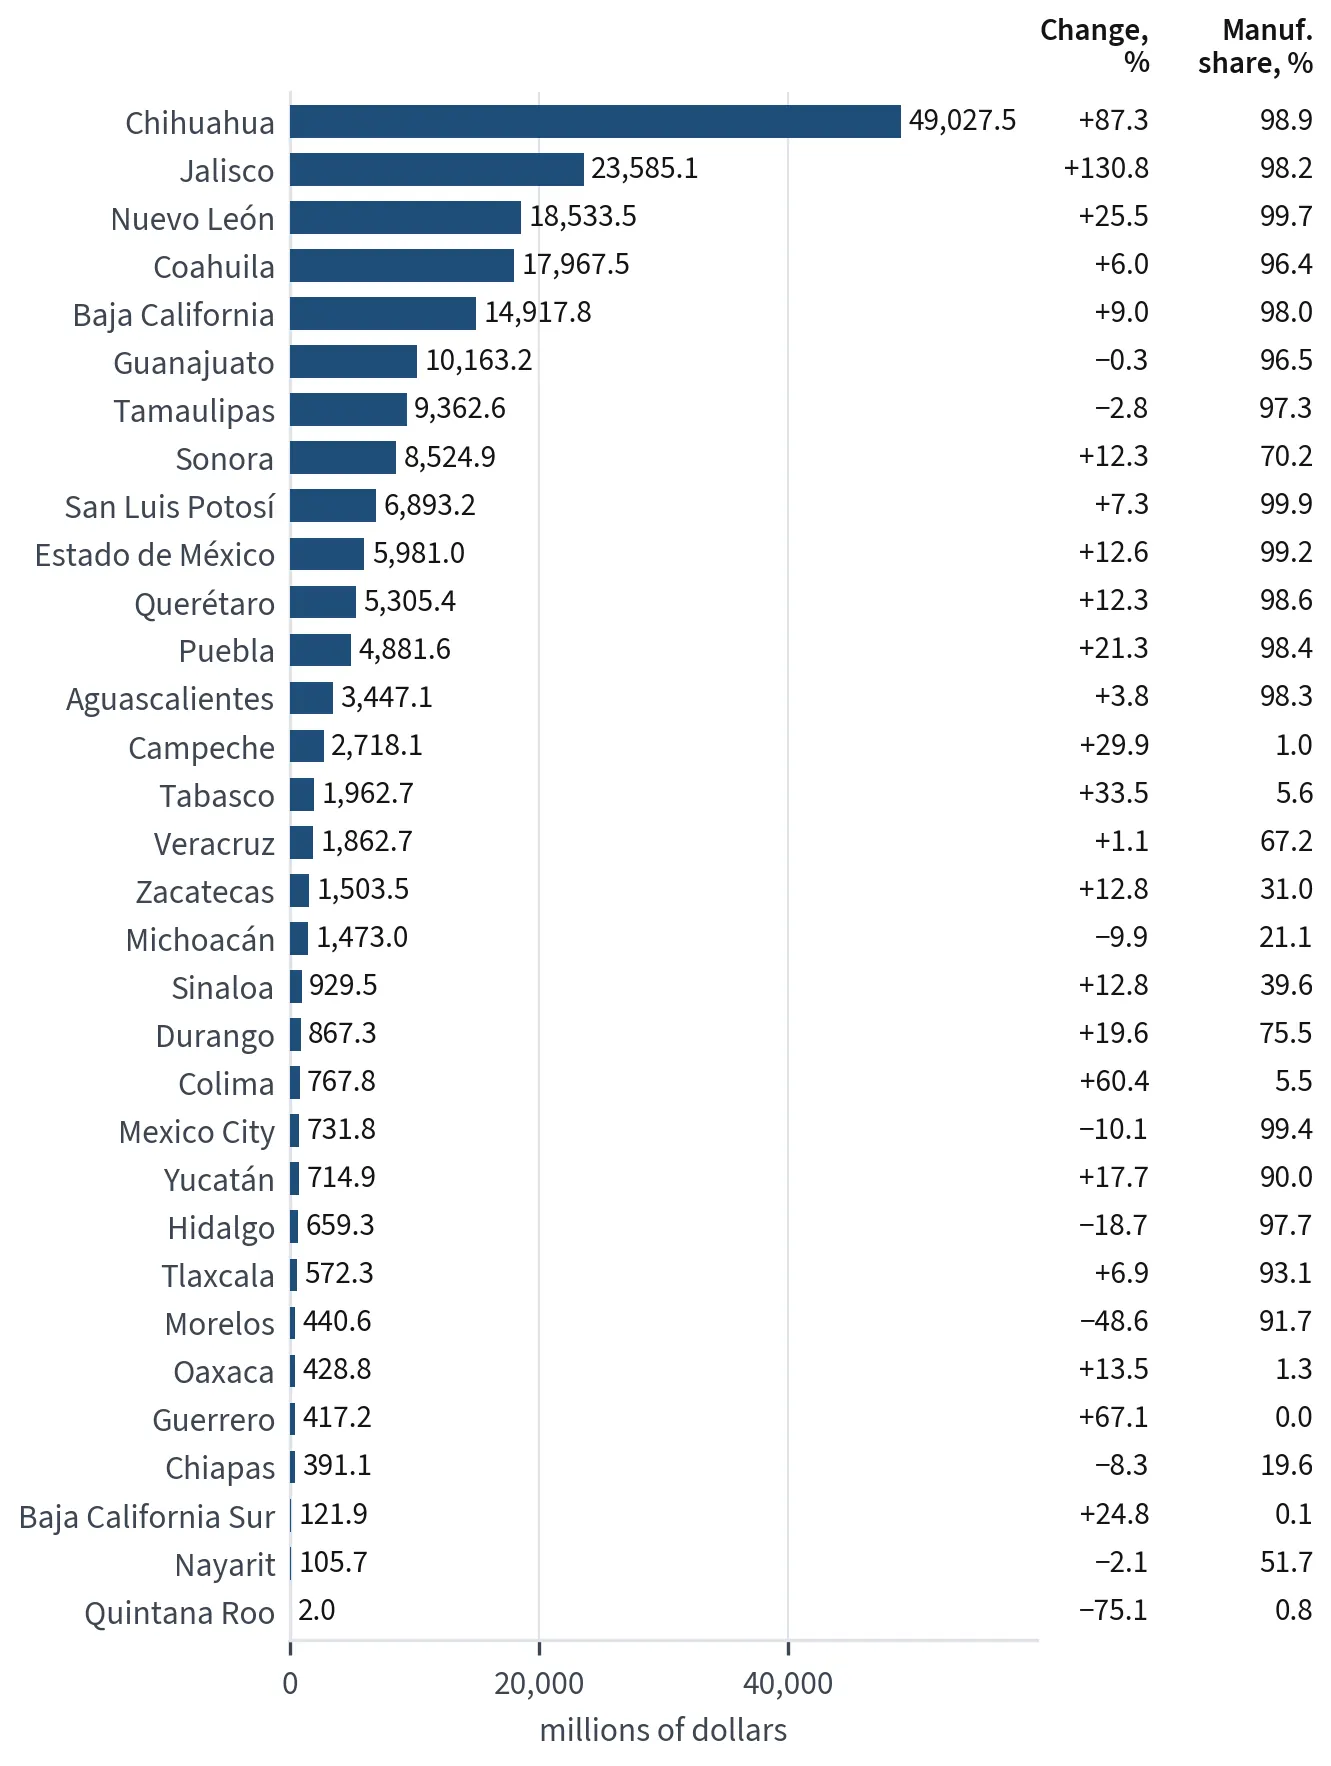
Map of Mexico's 32 states shaded in five steps by the year-on-year change in exports in the second quarter of 2026, from a fall of 75.1 percent in Quintana Roo to a rise of 130.8 percent in Jalisco, each labeled with its exports in billions of dollars: Chihuahua 49.0, Jalisco 23.6, Nuevo León 18.5,
Exports by state, second quarter of 2026Figure 7.4Source: INEGI, Exportaciones trimestrales por entidad federativa (ETEF), bulletin 609/26, published September 30, 2026.
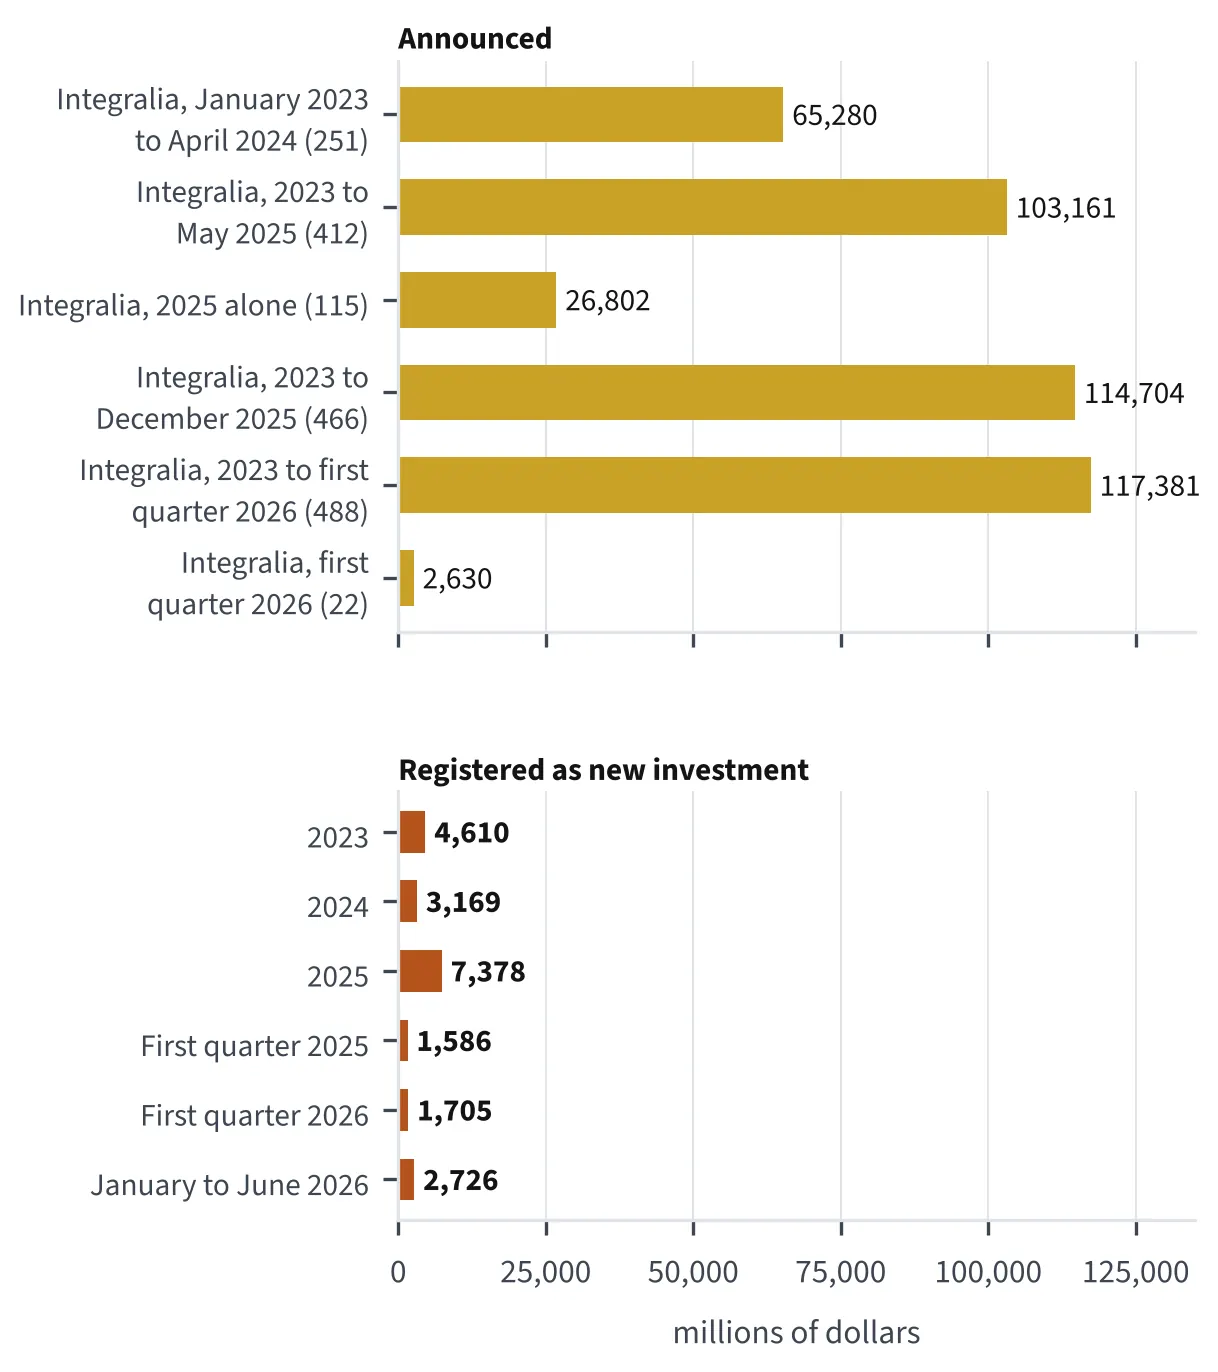
Two groups of horizontal bars. Announced, by Integralia's count: 65,280 million dollars (251 announcements, January 2023 to April 2024); 103,161 million cumulative (412, 2023 to May 2025, Integralia); 26,802 million (115, 2025 alone, Integralia); 114,704 million cumulative (466, 2023 to December 202
Announced against registered, 2023 to 2026Figure 7.5Sources: Secretaría de Economía announcement count (2024); Integralia, update of May 2025 (June 18, 2026 edition) and annual report 2025 as cited by México Evalúa, April 2026; Secretaría de Economía FDI presentation for 2023 (February 15, 2024) and 2025 figures as reported by La Razón (February 25, 2026); EFE citing the Secretaría de Economía, August 13, 2024; Integralia Consultores (2024 and April 28, 2026); Secretaría de Economía FDI reports (February 26, 2025; May 25, 2026); Expansión citing the Secretaría de Economía, August 24, 2026.
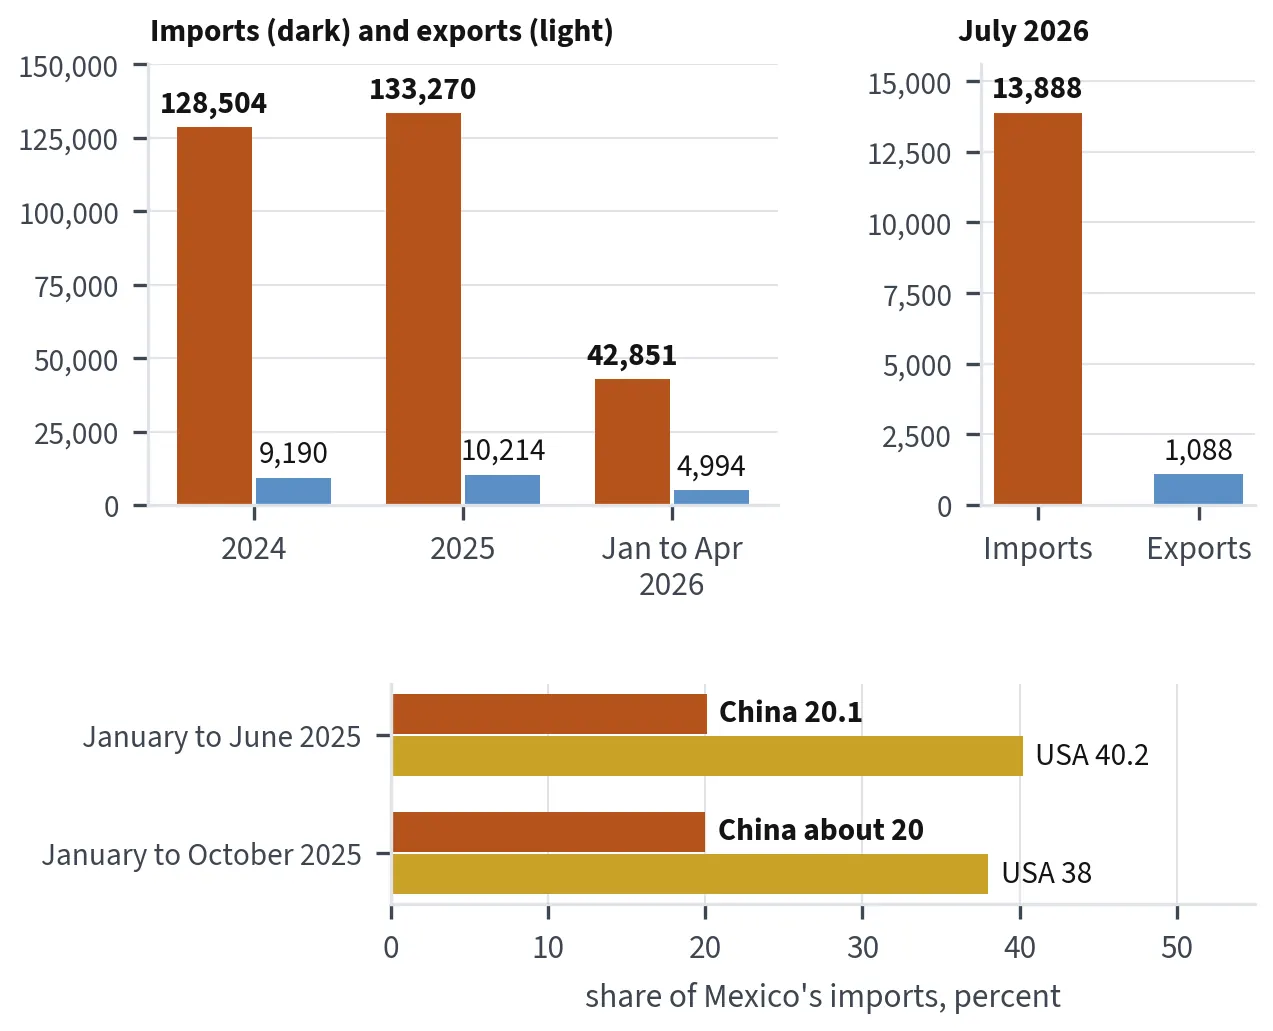
Top left: Mexico imported 128,504 million dollars of goods from China and exported 9,190 million to it in 2024; 133,270 and 10,214 million in 2025; 42,851 and 4,994 million in January to April 2026. Top right: in July 2026, imports of 13,888 million and exports of 1,088 million. Bottom: China suppli
Mexico's trade with ChinaFigure 7.6Sources: Monex citing INEGI, September 30, 2025 (2024); El CEO citing Banxico, June 17, 2026 (January to April 2026); La Jornada citing Banxico, December 15, 2025 and February 10, 2026; BBVA Research, September 2025; Secretaría de Economía, July 2026.
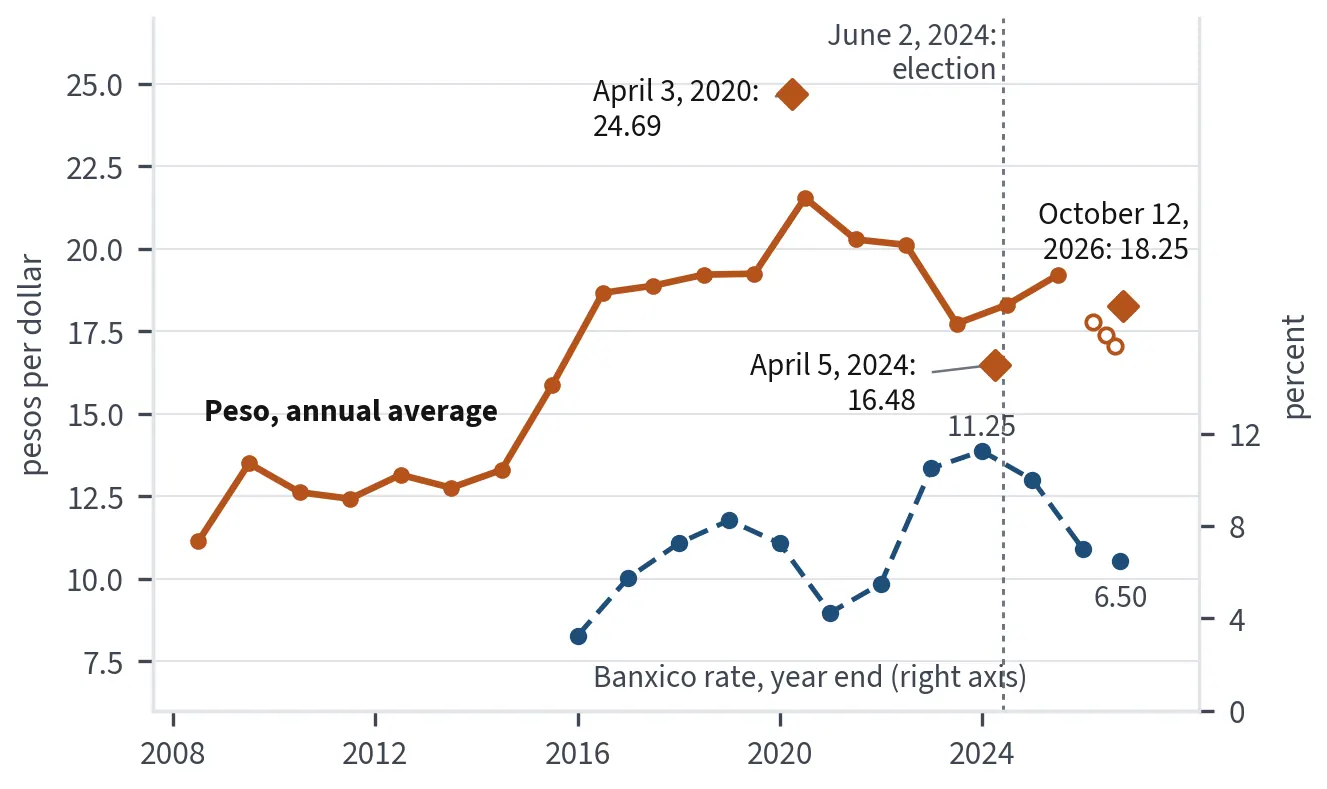
Line of the peso's annual average against the dollar from 11.14 in 2008 to 21.55 in 2020 and 19.21 in 2025, with the FIX at 24.69 on April 3, 2020, 16.48 on April 5, 2024, and 18.25 on October 12, 2026, the June 2, 2024, election marked, and a dashed line of Banxico's year-end policy rate from 3.25
The peso against the dollar, 2008 to October 2026Figure 8.1Sources: Federal Reserve, G.5A annual release (2008 to 2025, as read January 5, 2026) and FRED monthly series (read September 1, 2026); Federal Reserve Bank of Dallas (August 6, 2026); Banco de México FIX (October 12, 2026) and CEFP weekly report (April 3, 2020; April 5, 2024); Banco de México target rate via CEFP and México, ¿cómo vamos? (September 24, 2026).
Line chart of the peso, every month from January 2024 to September 2026, labeled at 17.09 in January 2024, 16.77 in March 2024, 20.34 in November 2024, 20.54 in January 2025, 18.07 in December 2025, 17.77 in March 2026, 17.4 in June 2026 and 17.06 in August 2026; daily readings of 17.25 on September
The peso in 2024 to 2026Figure 8.2Sources: Federal Reserve monthly and daily USD/MXN series via FRED (read September 1 and 21 and October 14, 2026); Federal Reserve Bank of Dallas (August 6, 2026); Banco de México FIX (September 25 and October 8, 9 and 12, 2026).
Two lines of policy rates: Banxico from 3.25 percent at the end of 2015 to 8.25 in 2018, 4.25 in 2020, 11.25 in 2023, 7.00 in 2025 and 6.50 on September 24, 2026; the Fed's upper bound from 0.25 at the end of 2020 and 2021 to 5.50 in 2023, 3.75 in 2025 and 4.00 on September 16, 2026; the gap between
Policy rates in Mexico and the United States, 2015 to September 2026Figure 8.3Sources: Banco de México target rate via CEFP (year ends 2015 to 2025) and México, ¿cómo vamos? (September 24, 2026); Federal Reserve Board, federal funds target range (year ends 2020 to 2025; decision of September 16, 2026).
Two lines of December-on-December inflation: Mexico 2.13 percent in 2015, 6.77 in 2017, 7.82 in 2022 and 3.69 in 2025, with 3.45 in September 2026; the United States 0.7 in 2015, 7.0 in 2021, 2.7 in 2025 and 3.4 in August 2026; the 2 to 4 percent band shaded.
Inflation in Mexico and the United States, 2015 to 2026Figure 8.4Sources: INEGI, INPC, December over December as tabulated by CEFP (2015 to 2024), INEGI (December 2025, published January 8, 2026; September 2026, published October 8, 2026); BLS, CPI-U, December over December as tabulated by usinflationcalculator.com (2015 to 2025), BLS (August 2026).
Horizontal bars for five countries on April 30, 2026: Colombia 232 basis points, Mexico 190, Brazil 174, Peru 120, Chile 83.
What markets charge Latin American governments, April 30, 2026Figure 8.5Source: J.P. Morgan EMBI as reported by Bloomberg Línea, close of April 30, 2026.
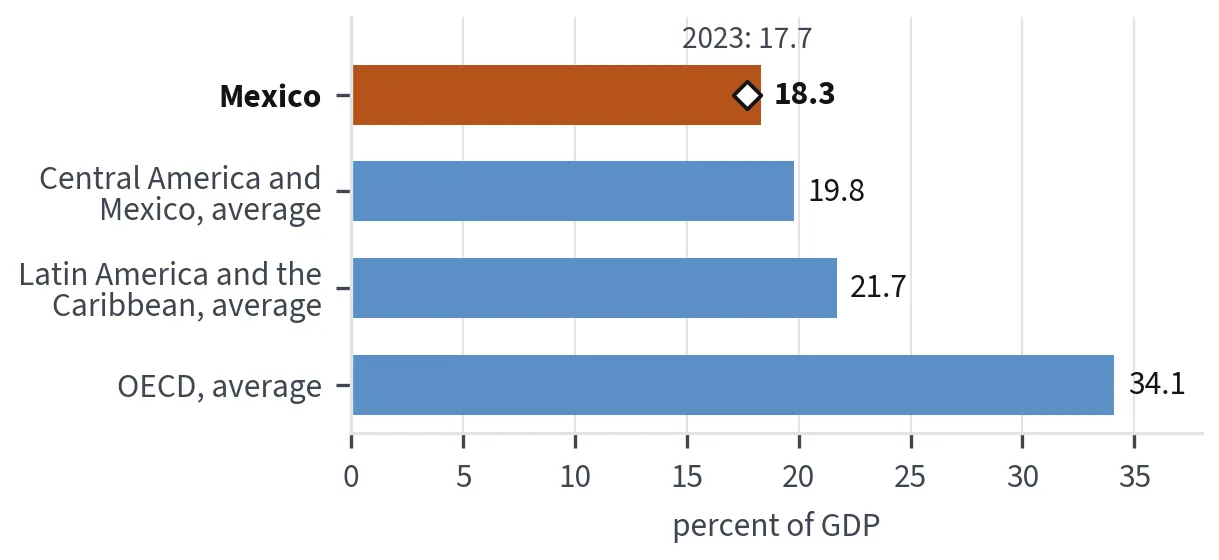
Horizontal bars of tax revenue as a share of GDP in 2024: Mexico 18.3 percent (17.7 in 2023), Central America and Mexico 19.8, Latin America and the Caribbean 21.7, OECD 34.1.
Tax revenue as a share of GDP, 2024Figure 9.1Source: OECD, Revenue Statistics in Latin America and the Caribbean 2026, published May 5, 2026 (OECD average as reported in the press, May 25, 2026).
Two bar panels. Left: oil revenue as a share of public-sector budget revenue, 34.0 percent on average under Calderón (2007 to 2012), about 16 percent in 2016 to 2017, 12.8 percent in 2024 and 14.3 percent projected for 2025. Right: oil revenue as a share of GDP, 3.5 percent in 2025, 3.0 estimated fo
Oil in the public financesFigure 9.2Sources: CEFP, July 2012, on the SHCP series (Calderón years); SHCP revenue series as reported in the press (August 4, 2025); SHCP, Criterios Generales de Política Económica 2027 (September 8, 2026).
Horizontal bars in billions of pesos for the 2027 proposal: pension for older adults 543.5, Benito Juárez scholarships 190.6, Rita Cetina scholarship 133.6, Sembrando Vida 40.5, other priority programs 117.3; below, the totals: 987.2 in the 2026 proposal and 1,025.4 in the 2027 proposal.
The priority social programs in the 2027 budget proposalFigure 9.3Sources: SHCP, Paquete Económico 2027 and Criterios Generales de Política Económica 2027 (September 8, 2026), via INDETEC (September 2026); SHCP, Paquete Económico 2026 (September 9, 2025).
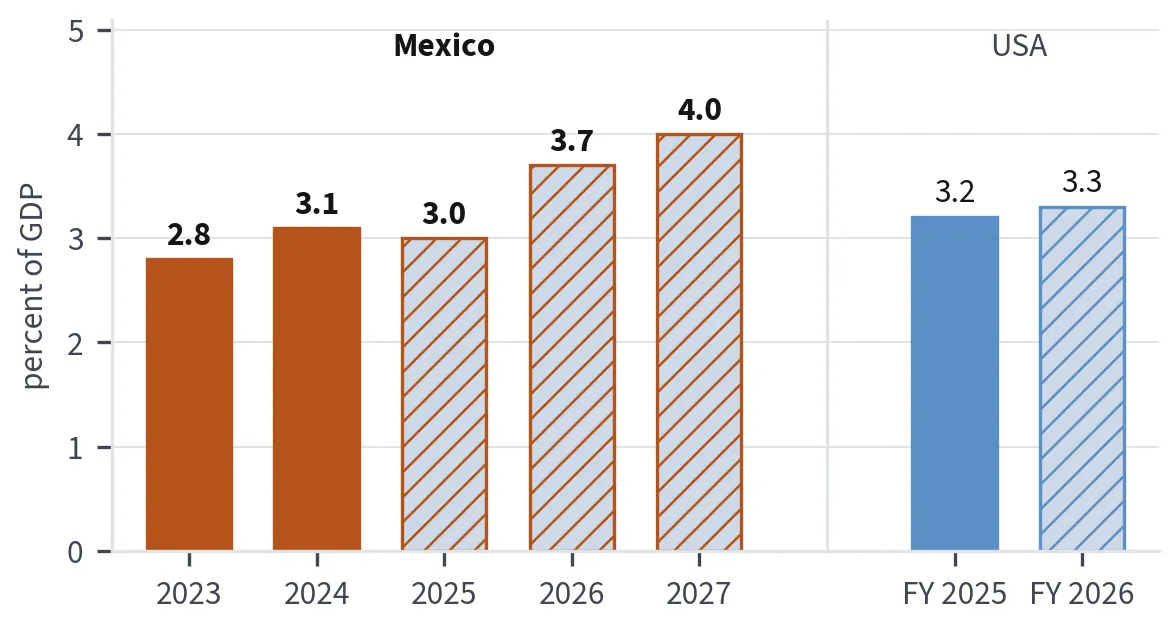
Bars of interest as a share of GDP: Mexico 2.8 percent in 2023, 3.1 in 2024, 3.0 projected for 2025, 3.7 in 2026 and 4.0 projected for 2027; the United States 3.2 percent in fiscal 2025 and 3.3 projected for fiscal 2026.
Interest on the public debt, Mexico and the United StatesFigure 9.4Sources: IMF, 2025 Article IV report on Mexico (October 2025); Mexico Evalúa (September 2026); SHCP, Criterios Generales de Política Económica 2027 (September 9, 2026); Congressional Budget Office (February 2026).
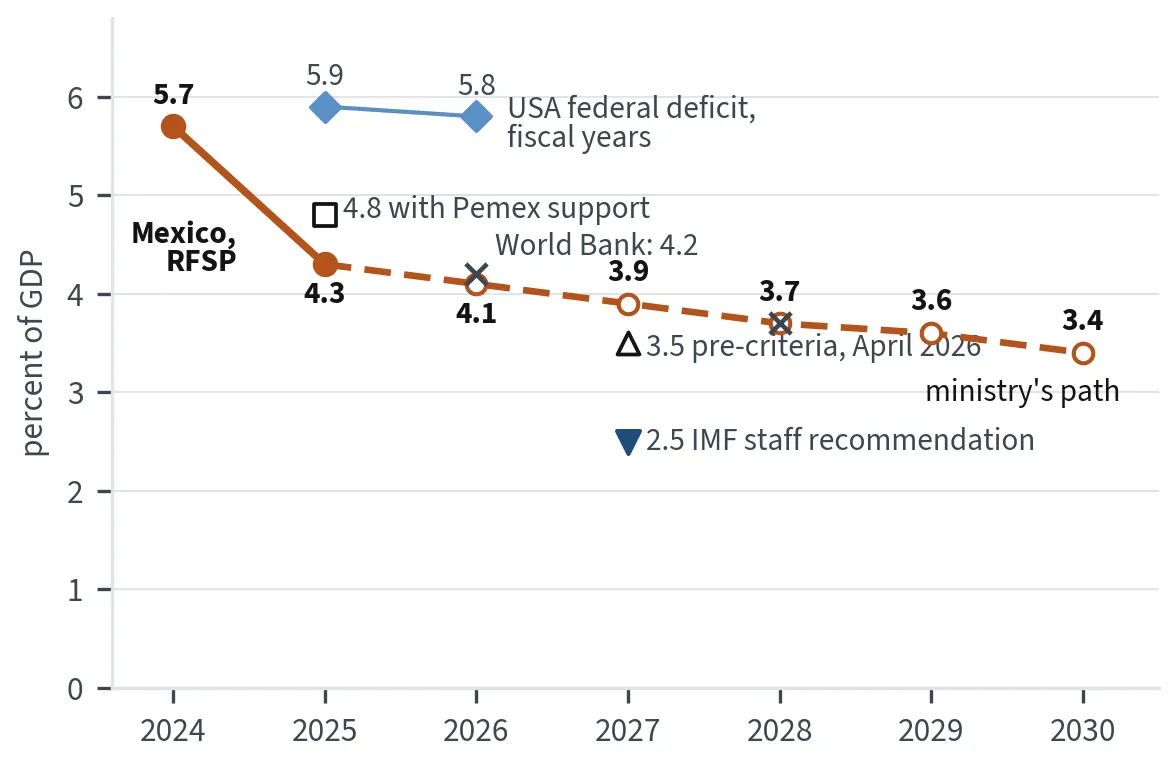
Line of Mexico's RFSP: 5.7 percent of GDP in 2024, 4.3 in 2025 (4.8 with Pemex support), 4.1 estimated for 2026, and the ministry's path of 3.9 in 2027, 3.7 in 2028, 3.6 in 2029 and 3.4 in 2030; markers for the April 2026 pre-criteria (3.5 in 2027), the IMF staff recommendation (2.5 in 2027) and the
Mexico's deficit, 2024 to 2030Figure 9.5Sources: SHCP, Criterios Generales de Política Económica 2027 (September 8, 2026) and Pre-Criterios 2027 (April 1, 2026); IMCO (September 2026); ADN Opinión (March 10, 2026); IMF staff, 2025 Article IV mission (September 19, 2025); World Bank, Mexico country overview (October 6, 2026); Congressional Budget Office (November 10, 2025 and February 2026).
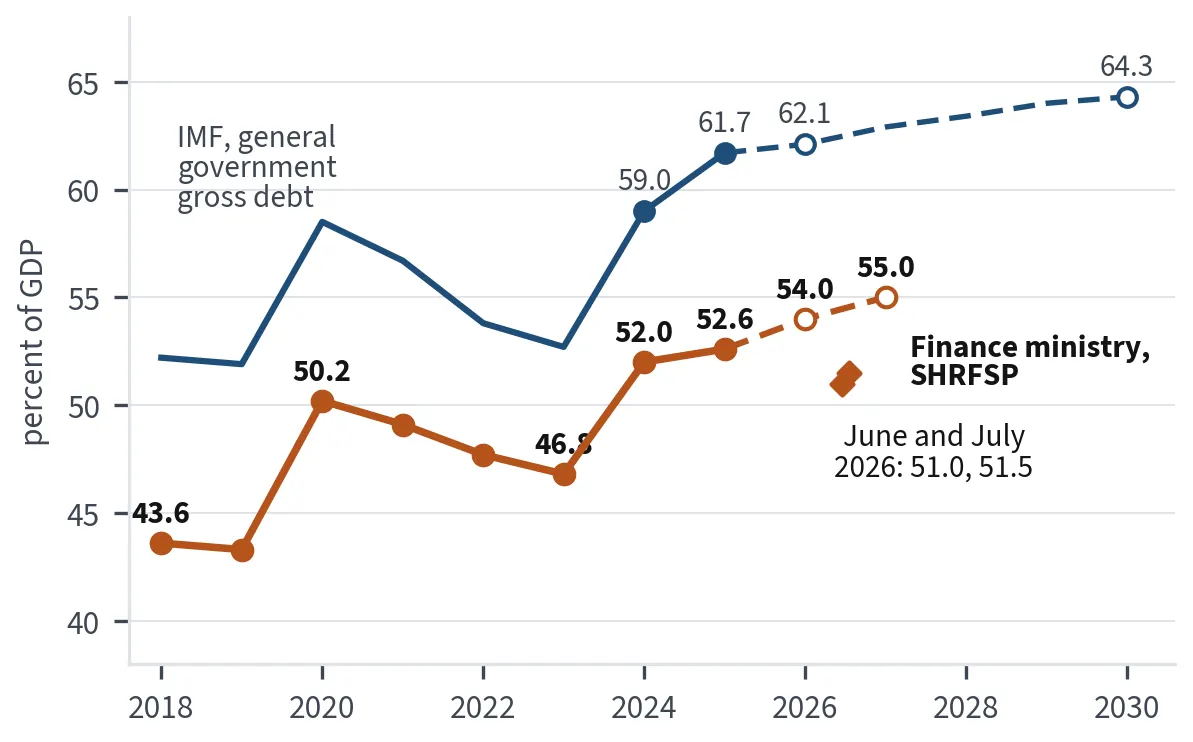
Two lines of public debt as a share of GDP from 2018: the ministry's SHRFSP at 43.6 percent in 2018 and 50.2 in 2020, 46.8 percent at the end of 2023, 52.0 in 2024, 52.6 in 2025, 51.0 in June and 51.5 in July 2026, projected 54.0 at the end of 2026 and 55.0 in 2027; the IMF's gross debt at 59.0 perc
Mexico's public debt, 2018 to 2030Figure 9.6Sources: SHCP (SHRFSP: end-2023; January 30, 2026 report for 2024 and 2025; June and July 2026 public-finance reports; Criterios Generales 2027, September 8, 2026); IMCO, Hacienda en la Mira 4T2025 (February 2026), for SHRFSP 2018 to 2022; IMF, World Economic Outlook and DataMapper (2018 to 2031 read October 14, 2026; 2024 and 2025 as relayed; 2026 read October 14, 2026; 2030 projection).
Two bar panels. Left: Pemex financial debt of 85.2 billion dollars on December 31, 2025, and 77.5 billion on June 30, 2026. Right: federal support of 411.5 billion pesos paid in 2025, 263.5 billion budgeted for 2026 and 81.1 billion proposed for 2027.
Pemex: the debt and the federal support behind itFigure 9.7Sources: Pemex quarterly results (February 27 and July 31, 2026) and filing (May 22, 2026); SHCP, Paquete Económico 2026 (September 2025); IMCO and México, ¿cómo vamos? on the 2027 proposal (September 9, 2026).
Two stacked bars. 2020 state revenue: own revenue 11 percent, federal transfers 82 percent, debt 7 percent. 2027 transfers to local governments of 3,048.2 billion pesos: participaciones 1,547.6, aportaciones 1,231.9, other 268.7.
Where the states' money comes fromFigure 9.8Sources: IMCO (February 28, 2022) for 2020; SHCP, Paquete Económico 2027 via INDETEC (September 2026); CIEP (April 15, 2025).
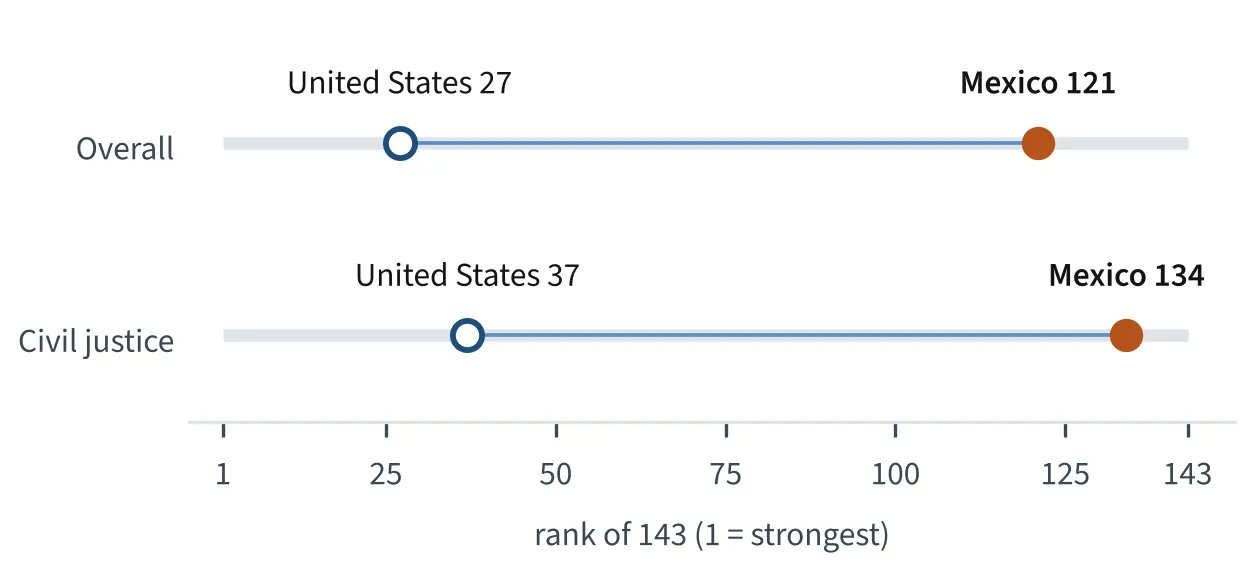
Three panels. World Justice Project 2025: Mexico ranks 121st of 143 overall and 134th on civil justice; the United States 27th and 37th. Transparency International CPI 2025: Mexico scores 27 of 100 and ranks 141st of 182. World Bank Enterprise Survey 2023: 15.8 percent of Mexican firms received a br
Mexico on three outside scalesFigure 10.1Sources: Transparency International, Corruption Perceptions Index 2025 (released February 10, 2026, as reported by Baker McKenzie); World Justice Project, Rule of Law Index 2025 (as read October 12, 2026; civil justice score per Uno TV); World Bank, Enterprise Surveys, Mexico 2023.
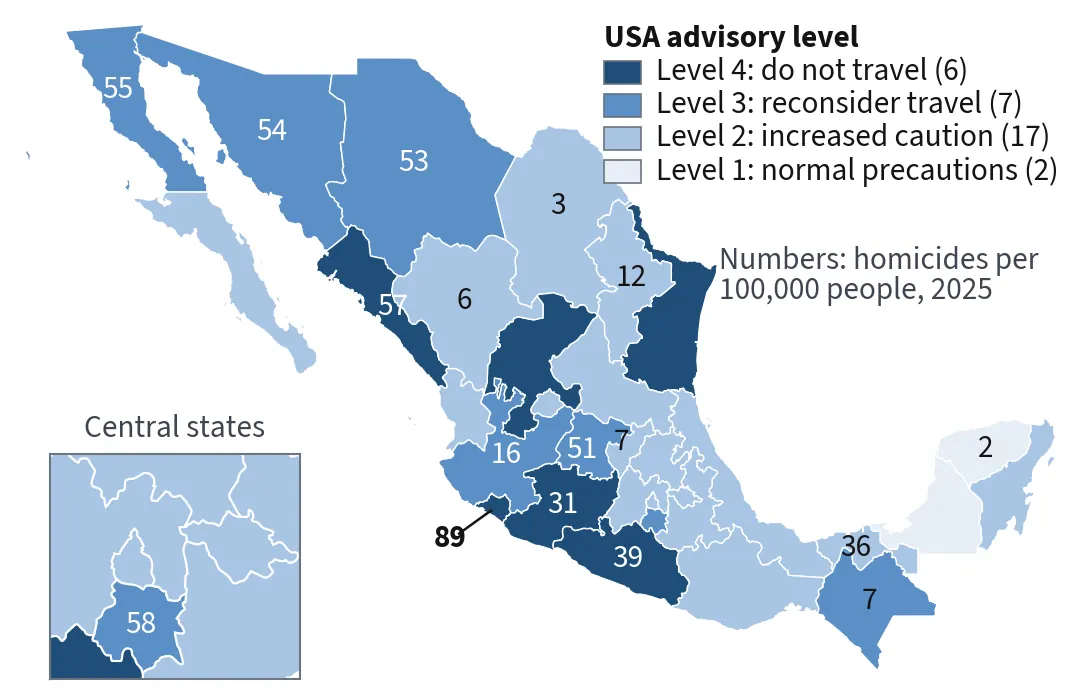
Top: dots of INEGI homicide counts, 27,213 in 2011, 36,685 in 2018, 33,550 in 2024 and 27,989 in 2025, and every year between, 36,661 in 2019, 36,773 in 2020, 35,700 in 2021, 33,287 in 2022 and 32,252 in 2023; SESNSP's victims of intentional homicide and femicide, 30,918 in 2024 and 24,344 in 2025.
Homicide in Mexico, and by state in 2025Figure 10.2Sources: INEGI, Defunciones por homicidio (2011 and 2018 as published September 23, 2020; 2024 definitive; 2025 preliminary, with state rates); SESNSP via Uno TV (2025) and Grupo Animal Político (August 5, 2026, for 2024 and 2025); 2024 national rate via Crónica and Excélsior.
Map of Mexico's 32 states by USA travel advisory level on May 29, 2026: Level 4 (do not travel) Colima, Guerrero, Michoacán, Sinaloa, Tamaulipas and Zacatecas; Level 3 (reconsider travel) Baja California, Chiapas, Chihuahua, Guanajuato, Jalisco, Morelos and Sonora; Level 1 (normal precautions) Campe
The USA travel advisory by state, May 29, 2026Figure 10.3Sources: United States Department of State, Mexico Travel Advisory (May 29, 2026; September 6, 2024); INEGI, Defunciones por homicidio 2025, preliminary.
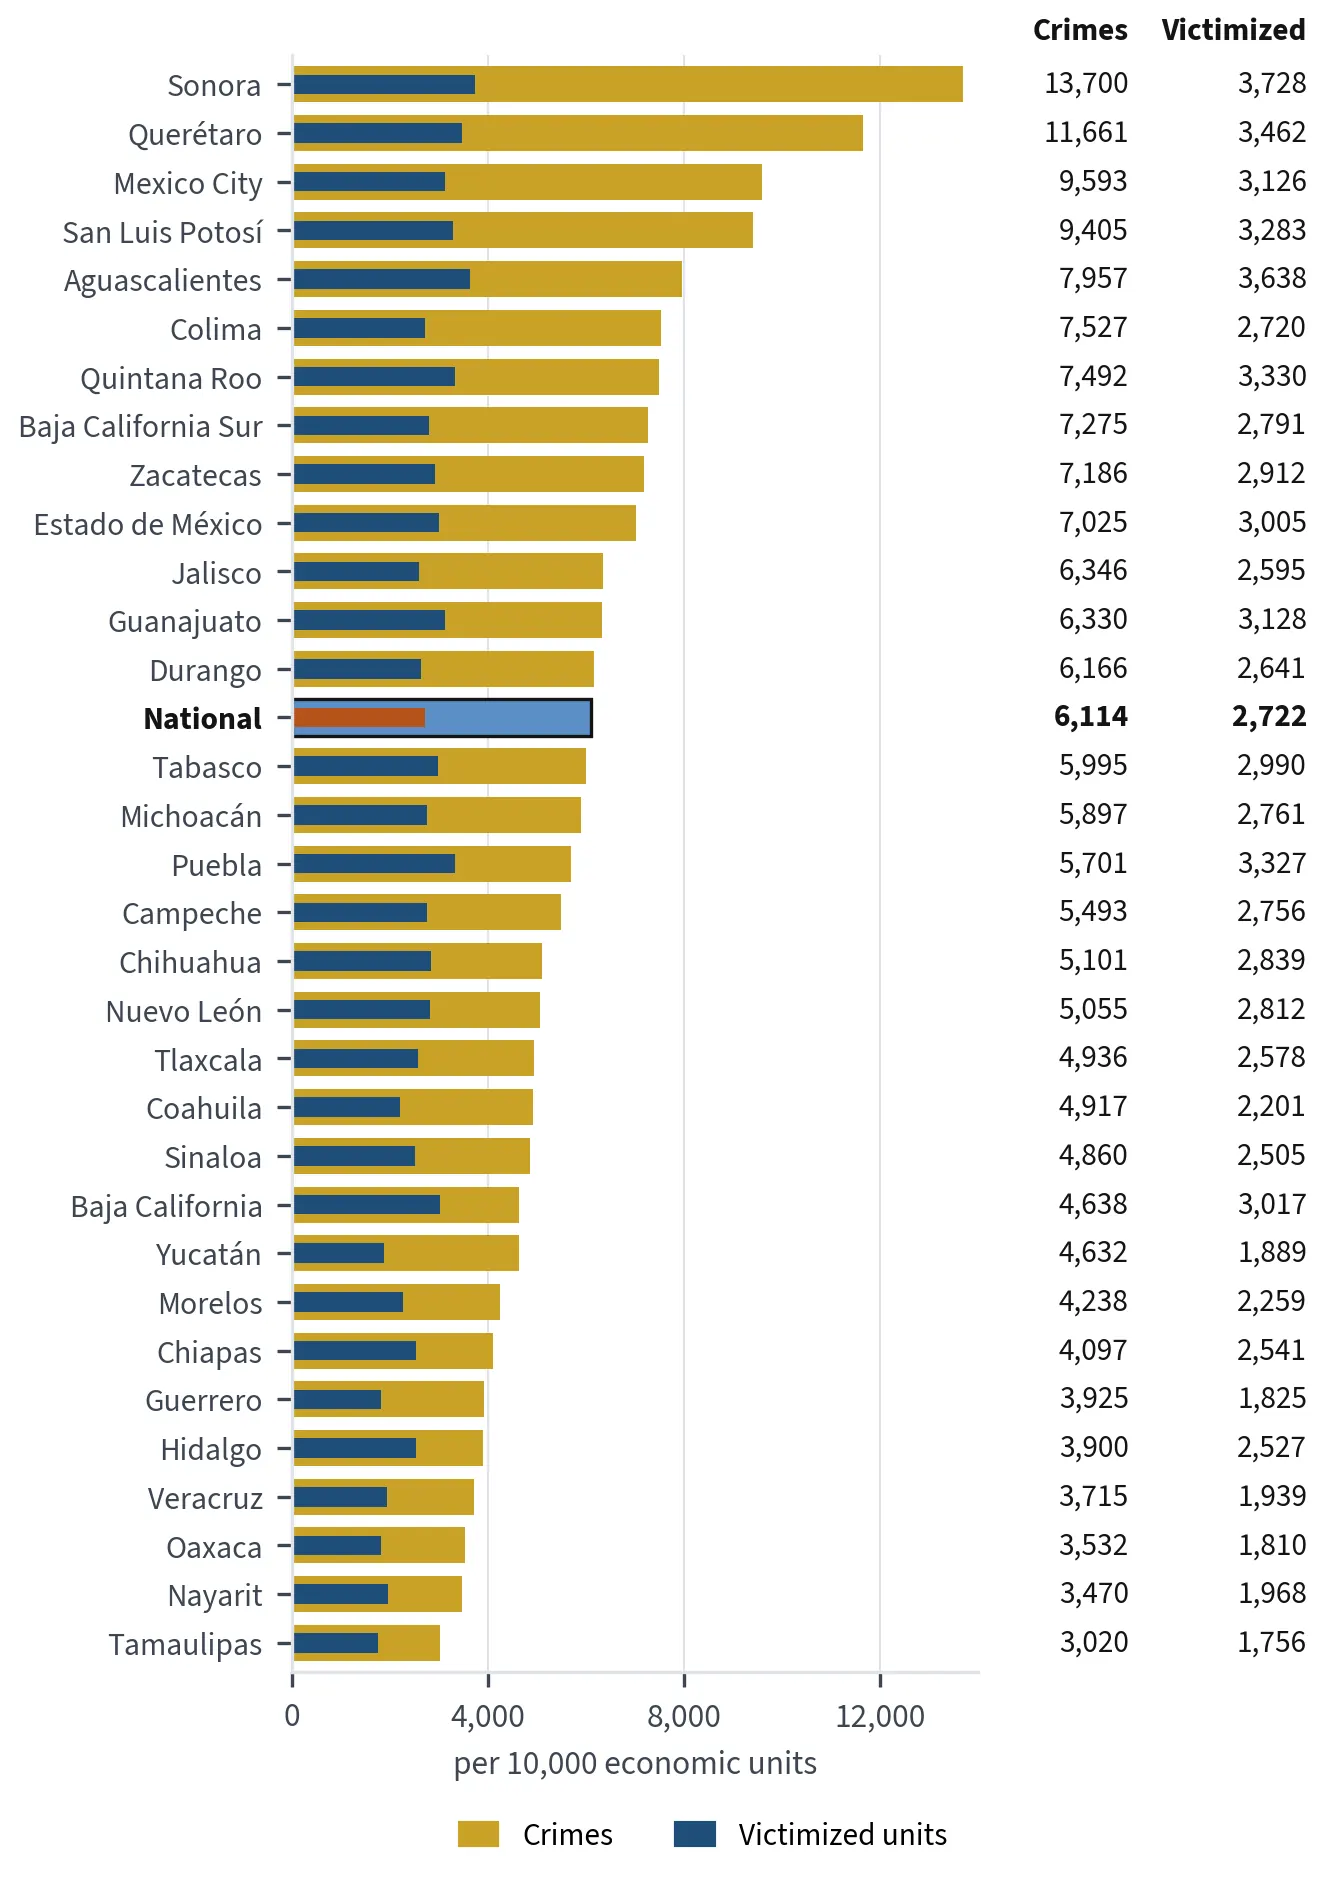
Horizontal bars for 32 states of the share of business units victimized in 2023, from Sonora 37.3 percent, Aguascalientes 36.4 and Querétaro 34.6 down to Guerrero 18.3, Oaxaca 18.1 and Tamaulipas 17.6; national 27.2 percent.
Crime against business by state, 2023Figure 10.4Source: INEGI, Encuesta Nacional de Victimización de Empresas (ENVE) 2024, reference year 2023 (read October 13, 2026).
Horizontal bars of the share of adults feeling unsafe in their city in June 2026: Villahermosa 84.2 percent, Guadalajara 78.0, León 70.8, Cancún 70.1, Tijuana 67.6, Ciudad Juárez 63.7, Monterrey 57.2, Mérida 38.2, Querétaro 36.1, Saltillo 16.9; urban average 59.8.
Feeling unsafe in the city, June 2026Figure 10.5Source: INEGI, Encuesta Nacional de Seguridad Pública Urbana (ENSU), June 2026, published July 24, 2026.
Horizontal stacked bar of Mexico's labor force of 61.7 million in the second quarter of 2026: 33.1 million informal, 26.9 million formal and 1.7 million unemployed, with a separate bar for 9.7 million in manufacturing, and a bar for the USA civilian labor force of 170.3 million in September 2026.
Sixty million at work, second quarter of 2026Figure 11.1Sources: INEGI, Encuesta Nacional de Ocupación y Empleo (ENOE), second quarter of 2026, published August 25, 2026; USA Bureau of Labor Statistics, Current Population Survey, September 2026.
Map of Mexico's 32 states with Banco de México's four regions outlined, shaded by labor informality in the second quarter of 2026: lowest in Nuevo León 34.8 percent, Chihuahua 35.1 and Coahuila 35.5; highest in Oaxaca 80.1, Guerrero 77.6 and Chiapas 76.9; national 55.1. Below, dots of the unemployme
Where the informal workers are, second quarter of 2026Figure 11.2Sources: INEGI, Encuesta Nacional de Ocupación y Empleo (ENOE), second quarter of 2026, published August 25, 2026; regions: Banco de México, Reporte sobre las Economías Regionales, June 16, 2026.
Three panels. Employment in IMMEX plants every month, drifting down from 3.29 million in July 2024: 3.28 million in June 2024, 3.16 million in March 2026, 3.19 million in June 2026, 3.18 million in July 2026. Real average pay: 20,787 pesos a month in June 2024, 22,505 in March 2026, 22,840 in June 2
IMMEX export plants: fewer jobs, higher pay, June 2024 to July 2026Figure 11.3Source: INEGI, Estadística mensual del programa IMMEX, monthly bulletins July 2024 to July 2026 (read October 14, 2026), and those for June 2024, March 2026 (May 21, 2026), June 2026 (August 20, 2026) and July 2026 (September 23, 2026); real remuneration deflated by the INPC.
Two lines of daily minimum wages in pesos. General: 88.36 in 2018, 102.68 in 2019, 123.22 in 2020, 141.70 in 2021, 172.87 in 2022, 207.44 in 2023, 248.93 in 2024, 278.80 in 2025 and 315.04 in 2026. A dashed line shows the 2018 minimum carried forward at consumer-price inflation, reaching about 129 p
The minimum wage since 2018Figure 11.4Sources: INEGI, INPC bulletins of each January, 2019 to 2026; CONASAMI resolutions for each year, published in the Diario Oficial de la Federación (for 2026, December 9, 2025); northern border free zone created January 1, 2019 (DOF, December 26, 2018).
Step chart of weekly hours, 2026 to 2030. Legal week and day shift: 48, 46, 44, 42, 40. Mixed shift: 45, 45, 44, 42, 40. Night shift: 42, 42, 42, 42, 40. Lower panel: overtime allowed at double time, hours a week: 9, 9, 10, 11, 12.
The working week, 2026 to 2030Figure 11.7Sources: Diario Oficial de la Federación, constitutional decree of March 3, 2026 (transitory article three) and reform of the Ley Federal del Trabajo of May 1, 2026; Greenberg Traurig, May 8, 2026.
Top: national multidimensional poverty 41.9 percent in 2018, 43.9 in 2020, 36.3 in 2022 and 29.6 percent in 2024; extreme poverty 7.0 percent in 2018, 8.5 in 2020, 7.1 in 2022 and 5.3 in 2024. Bottom: 32 states ranked by multidimensional poverty in 2024, from Chiapas 66.0, Guerrero 58.1 and Oaxaca 5
Poverty falls, and stays in the south, 2018 to 2024Figure 11.8Sources: INEGI, Pobreza multidimensional 2024 (ENIGH 2024), published August 13, 2025; CONEVAL, Medición de la pobreza 2020, August 5, 2021; regions: Banco de México, Reporte sobre las Economías Regionales, June 16, 2026.
Horizontal bars of domestic credit to the private sector as a share of GDP: Mexico 35.5 percent, Colombia 39.9, Latin America and the Caribbean 52.9, Brazil 75.1, Chile 102.1, world 140.3 (2024), OECD 147.3 (2024), USA 201.3. Diamonds mark the ABM's ratio of credit to the private sector from all len
How little Mexico lends, 2025Figure 12.1Sources: World Bank, World Development Indicators, domestic credit to private sector (percent of GDP), 2024 and 2025; Asociación de Bancos de México (ABM), presentation of August 26, 2026, from Bank for International Settlements data; Bank for International Settlements, credit to the non-financial sector, fourth quarter of 2025.
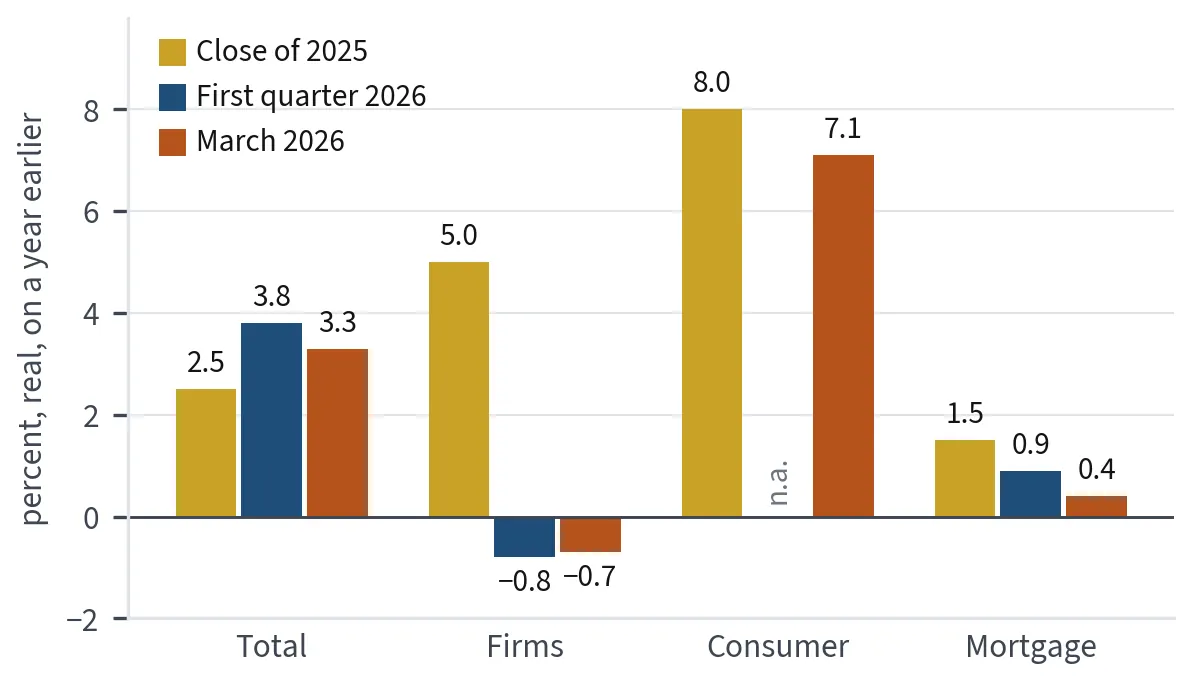
Grouped bars of real annual credit growth. Total: 2.5 percent at the close of 2025, 3.8 in the first quarter of 2026, 3.3 in March 2026. Firms: 5.0 at the close of 2025, minus 0.8 in the first quarter of 2026. Consumer: 8.0 at the close of 2025, 7.1 in March 2026. Mortgage: 0.9 in the first quarter
Credit slows, except to consumers, end of 2025 to March 2026Figure 12.2Sources: Banco de México, financing to the private sector, January 2026; BBVA Research, Situación Banca México, May 2026, as reported in the press.
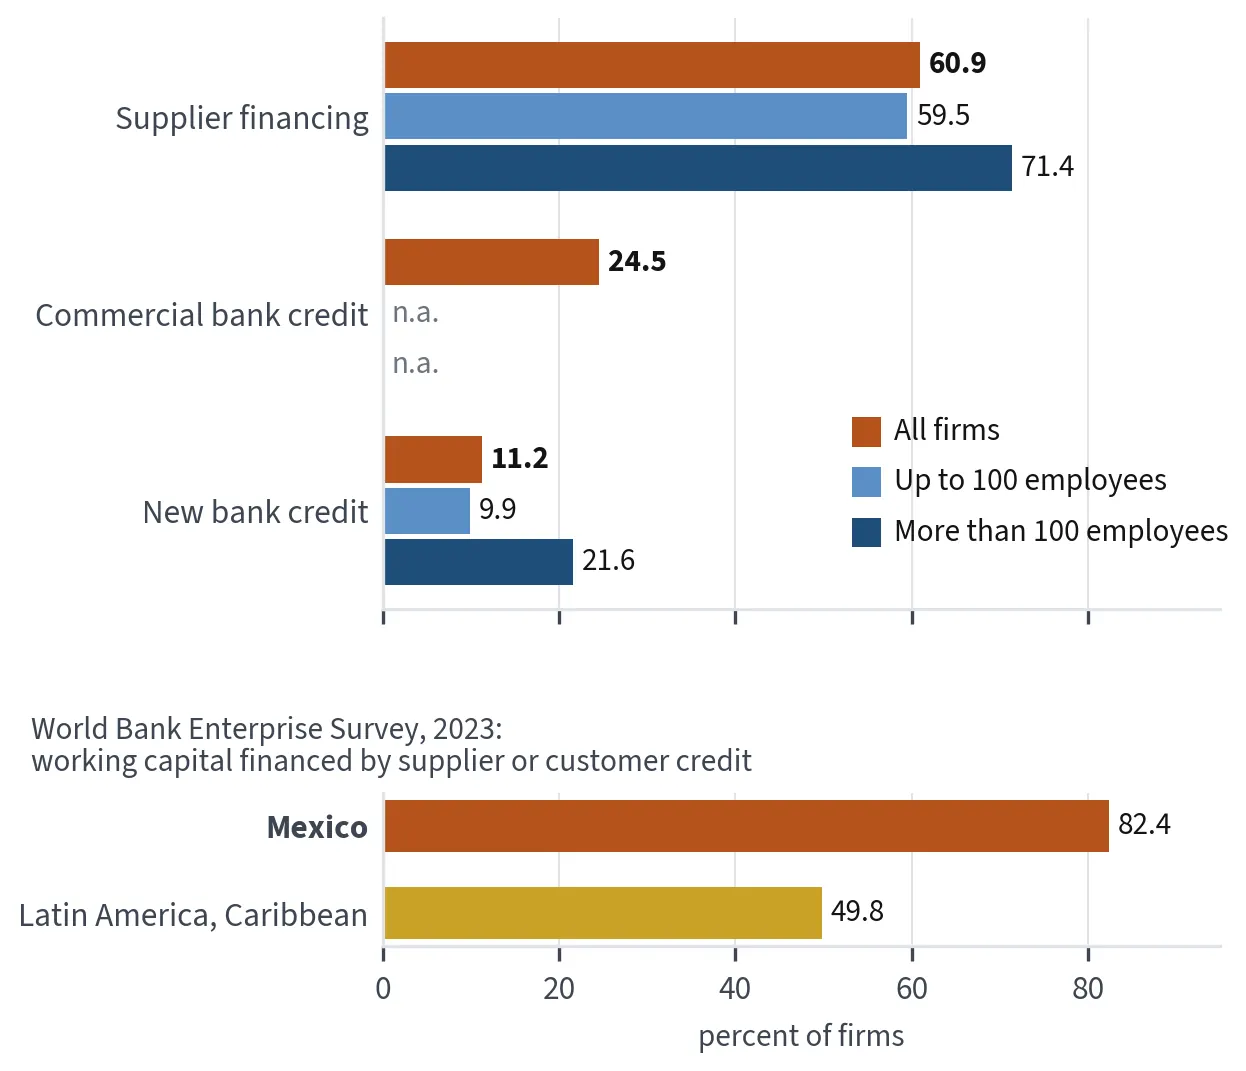
Top: share of firms in the second quarter of 2026 using supplier financing, 60.9 percent of all firms, 59.5 of firms with up to 100 employees and 71.4 of larger firms; commercial bank credit 24.5 percent of all firms; new bank credit 11.2 percent of all firms, 9.9 of the smaller and 21.6 of the larg
How firms finance themselvesFigure 12.3Sources: Banco de México, Encuesta de Evaluación Coyuntural del Mercado Crediticio, second quarter of 2026; World Bank, Enterprise Surveys, Mexico 2023.
Top: purchases up to 500 pesos, cash 90.1 percent in 2021; in 2024, cash 81.0 percent, card 13.0, transfer or app 4.2; over 500 pesos, cash 70.8 percent in 2021 and 65.3 in 2024, card 26.9 in 2024. Middle: in 2025, 12,118.9 million card payments, 7,308.1 million SPEI transfers and 3.1 million DiMo t
How Mexicans payFigure 12.5Sources: INEGI and CNBV, Encuesta Nacional de Inclusión Financiera (ENIF) 2021 (2022) and 2024, published March 13, 2025; Banco de México, payment systems report for 2025 (April 30, 2026); Federal Reserve, Diary of Consumer Payment Choice, October 2025 (published May 11, 2026).
Horizontal bars. Adults with any financial product: 56 percent in 2012, 68.4 in 2015, 76.5 in 2024. By product in 2024: account 63.0, retirement account 42.2, credit 37.3, insurance 22.9. By sex: men 80.9 and women 72.8 with any product; account 68.0 and 58.6; credit 38.8 and 36.1; insurance 28.2 an
Who has a financial product, 2024Figure 12.6Source: INEGI and CNBV, Encuesta Nacional de Inclusión Financiera (ENIF) 2024, published March 13, 2025, with the 2012 and 2015 totals from the same series.
Horizontal bars in trillions of pesos: Afore assets 8.1 in November 2025 (about 23 percent of GDP) and 8.95 in June 2026 (about 25 percent); commercial-bank credit to the private sector 7.3 in December 2025 (about 27 percent of GDP on the World Bank's measure); equity market capitalisation 9.2 in mi
Where long-term savings sitFigure 12.7Sources: World Bank, World Development Indicators (read October 14, 2026); CONSAR, November 12, 2025 (assets and 2050 projection), and as reported for June 30, 2026; Banco de México, financing to the private sector, December 2025 (January 2026); Grupo BMV, investor presentations for the first half of 2025 and the first quarter of 2026.
Top: Infonavit placed 530,525 credits in 2021 worth 234,890 million pesos and 530,300 in 2025 worth 321,800 million at constant prices. Bottom: bank mortgage rates on a 20-year loan from 10.15 to 14.20 percent (October 2025); implicit rate on the bank mortgage book about 10.0 percent (July 2026); av
Housing credit and what it costs, 2021 to 2026Figure 12.9Sources: Banco de México, monetary policy decisions (read October 14, 2026), and mortgage rate via El Universal (February 22, 2026); Infonavit via Inmobiliare (June 3, 2026) and Publimetro (January 14, 2026); CNBV via Expansión (May 26, 2026); Condusef comparison via Publimetro (October 13, 2025); BBVA Research via Reforma (July 16, 2026); Freddie Mac, Primary Mortgage Market Survey, October 8, 2026.
Top: bars of the ratio of richest to poorest state in output per person: Mexico City to Chiapas 6.7 and Nuevo León to Chiapas 5.4 (Mexico, 2024); New York to Mississippi 2.2 (USA, 2025). Bottom: range of state real GDP growth: Mexico 2024 from minus 6.9 percent in Campeche to 5.4 in Oaxaca; USA 2025
The regional gap in two countriesFigure 13.1Sources: CEIEG Chiapas, from INEGI preliminary state GDP 2024 (base 2018) and CONAPO population projections; BEA, GDP by state, September 30, 2026, and Census Bureau population; INEGI, state GDP 2024, December 5, 2025; BEA, GDP by state 2025, April 9, 2026.
Map of Mexico's 32 states shaded in five steps by output per hour worked in the first quarter of 2026, from 92 pesos in Chiapas to 559 in Campeche, with heavy lines around the seven corridors (Pacific border, Texas-facing north, Bajío and center-north, West, Center, Gulf and Isthmus, Peninsula) and
Mexico's corridors and what an hour of work produces, first quarter of 2026Figure 13.2Sources: México, ¿cómo vamos?, Semáforos estatales, labor productivity, first quarter of 2026 (consulted October 13, 2026), a single source; port and crossing positions, Wikipedia (read October 14, 2026).
Scatter of 32 states: output per hour worked in the first quarter of 2026 against multidimensional poverty in 2024. The deep south sits at low output and high poverty (Chiapas 92 pesos and 66.0 percent, Guerrero 109 and 58.1, Oaxaca 135 and 51.6); the north at high output and low poverty (Nuevo León
Output per hour and poverty, by stateFigure 13.3Sources: México, ¿cómo vamos?, Semáforos estatales, first quarter of 2026; INEGI, Pobreza multidimensional 2024, published August 13, 2025.
Horizontal bars of regional shares of GDP in 2024: center 38.3 percent, north 25.2, center-north 19.8, south 16.6. Arrows: economic activity fell in all four regions in the first quarter of 2026 and rose in all four in the second; manufacturing rose in the north, center-north and south in the second
Banxico's four regions, 2024 and 2026Figure 13.4Source: Banco de México, Reporte sobre las Economías Regionales, June 16, 2026 (shares and first quarter) and September 10, 2026 (second quarter).
Chart of growth forecasts from 2026 to 2036: the Banxico survey's ten-year average of 1.83 percent drawn across 2027 to 2036, with 2.0 in 2028; IMF 1.2 in 2026, 1.9 in 2027 and 2.1 in 2030; OECD 1.5 in 2026 and 1.8 in 2027; the finance ministry's range of 1.5 to 2.5 for 2027; HR Ratings base case 1.
Growth forecasts for Mexico, 2026 to 2036Figure 14.1Sources: Banco de México, Encuesta sobre las Expectativas de los Especialistas en Economía del Sector Privado (July 2026); IMF, Mexico 2025 Article IV (October 2025) and World Economic Outlook Update (July 2026); OECD, Interim Economic Outlook (September 2026); SHCP, Criterios Generales de Política Económica 2027; HR Ratings (June 2026, press relay); World Bank, World Development Indicators.

Selling It in Mexico

65 figures. See the book

Two bar charts: US goods exports, imports and total trade with Mexico in 2025; Mexico's share of US imports, 2025 to 2026.
The customer next doorFigure 2.1Source: US Census Bureau, trade in goods with Mexico, read October 20, 2026 (2025 trade); Congressional Research Service, IF11175, August 13, 2026 (goods and services); Mexico News Daily, September 8, 2026 (import shares); US Census data via FreightWaves, September 10, 2026.
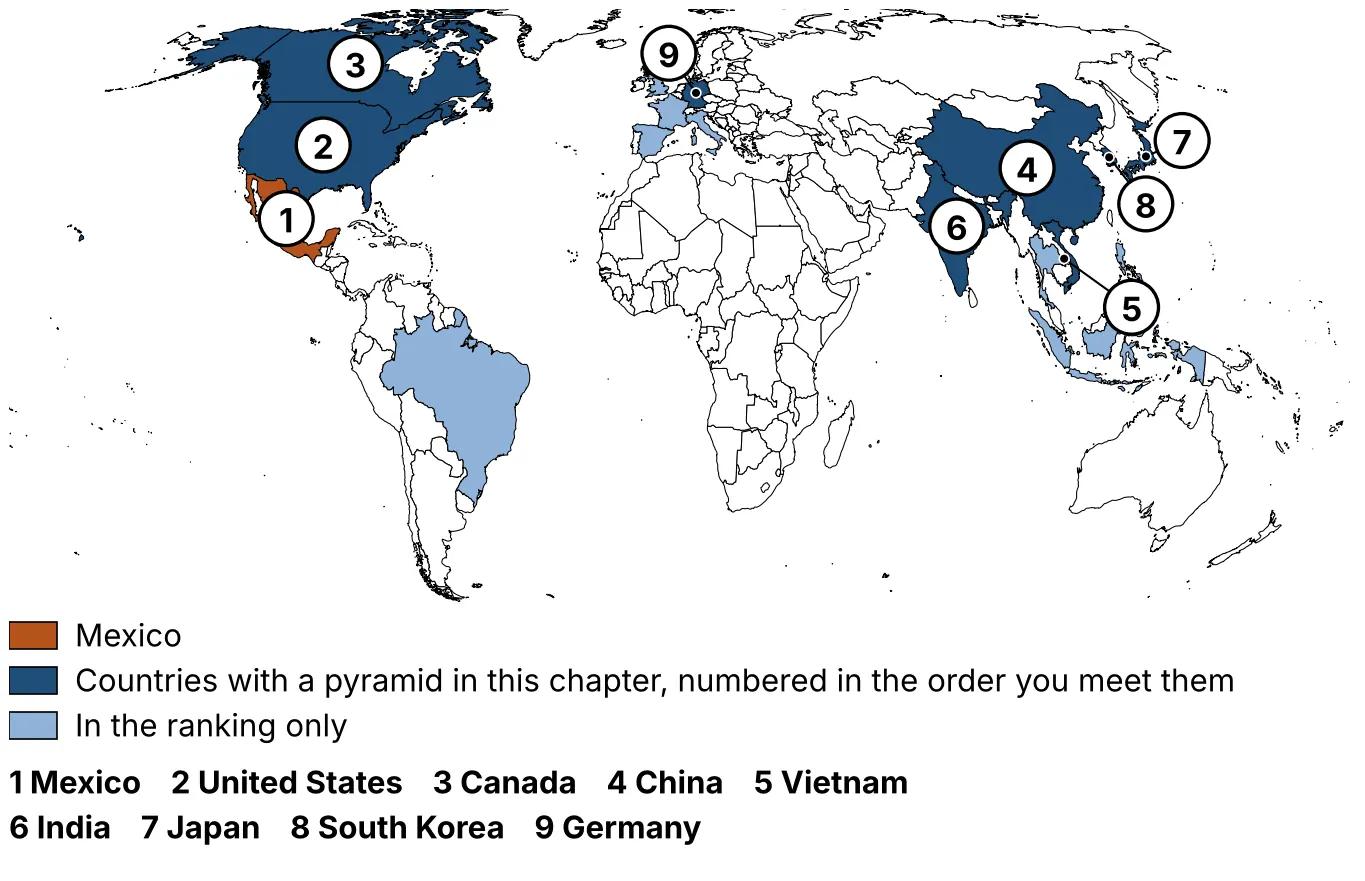
Where the comparison countries are: chart from COS101D (Chapter 2 demographics).
Where the comparison countries areFigure 2.2Outlines: Natural Earth, 1:50 million (public domain). Equal Earth projection.
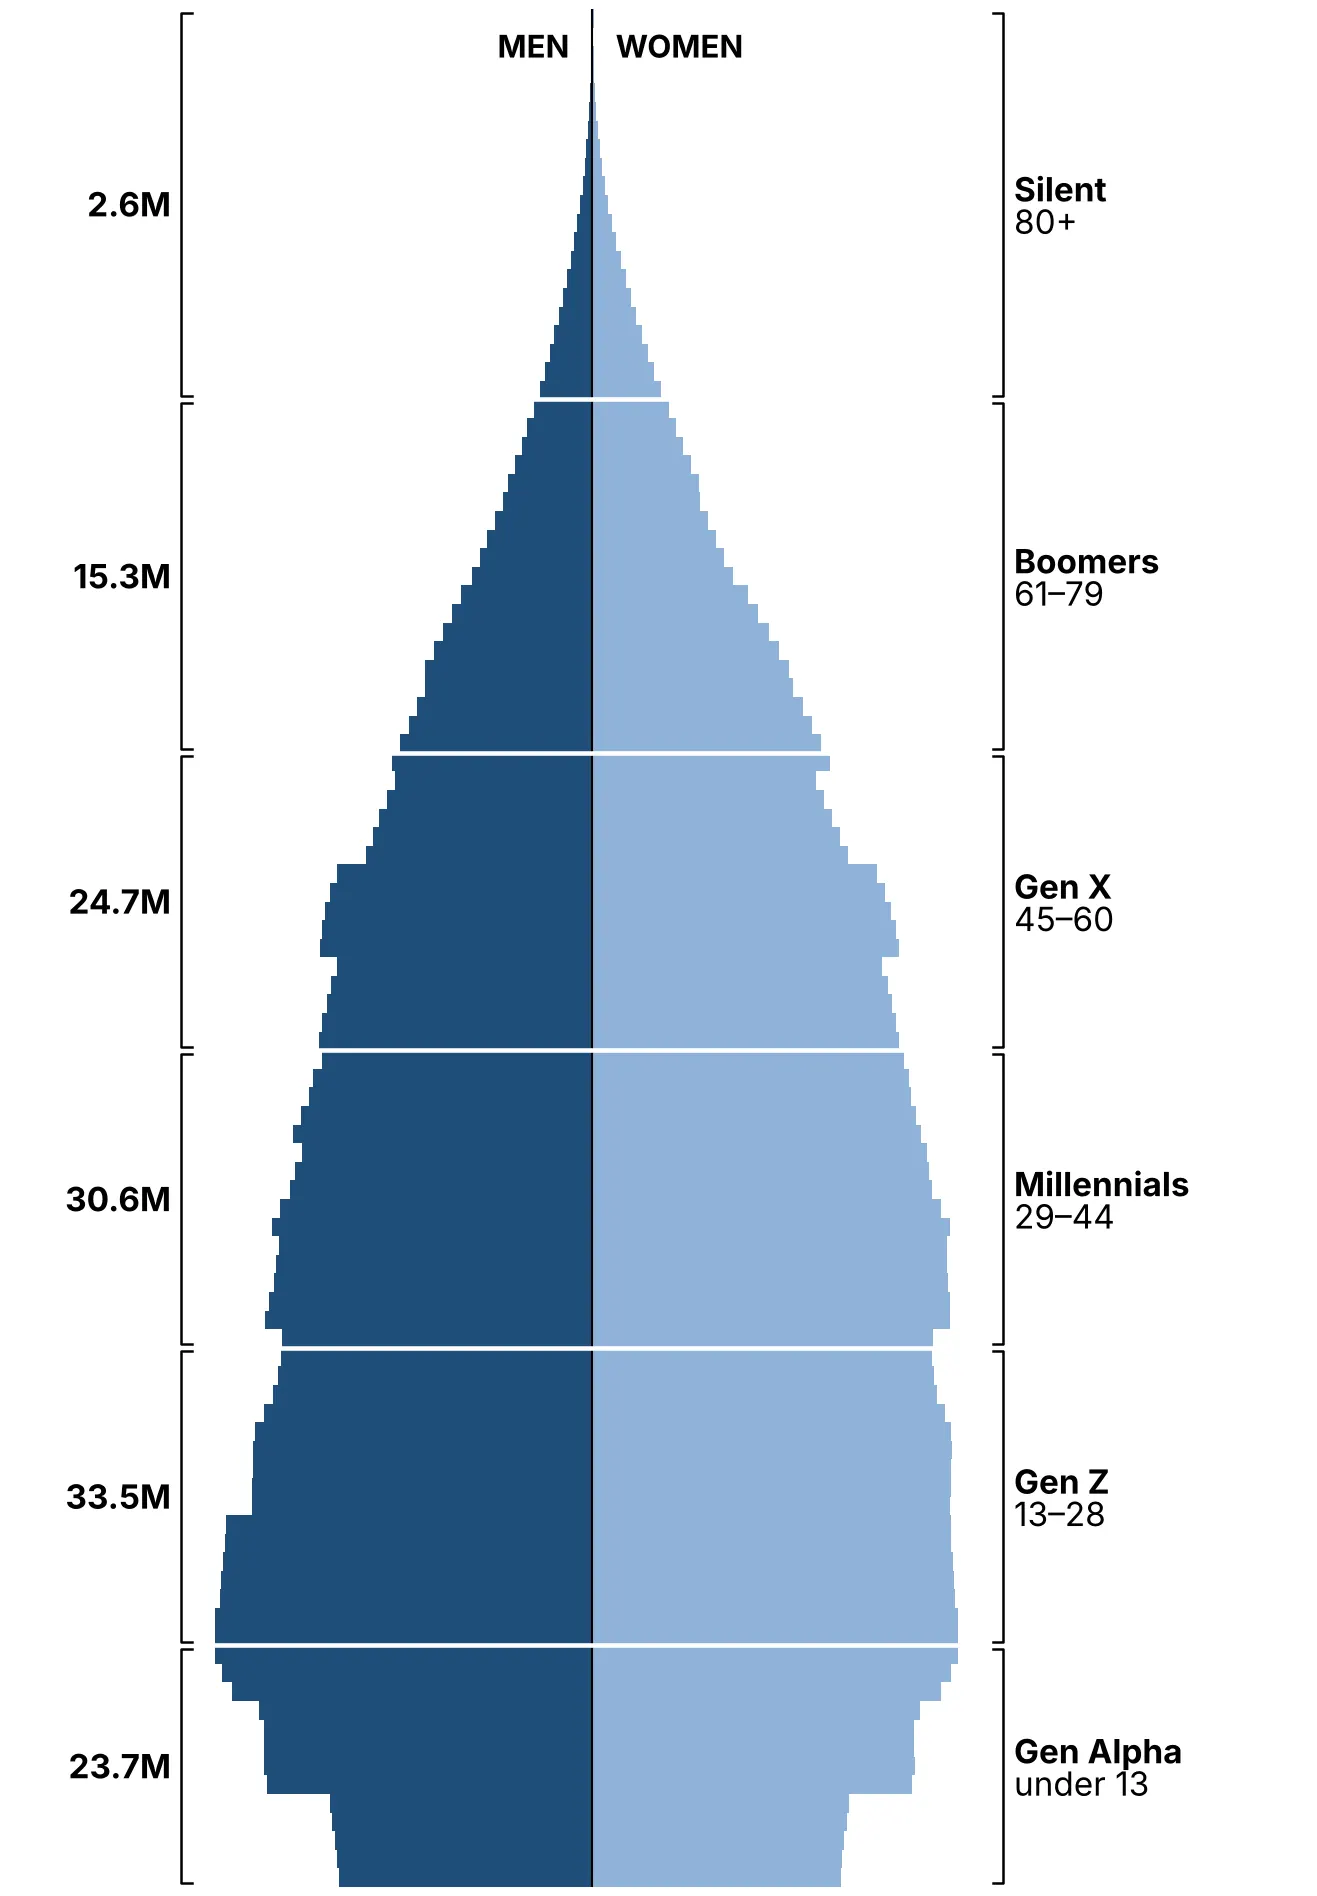
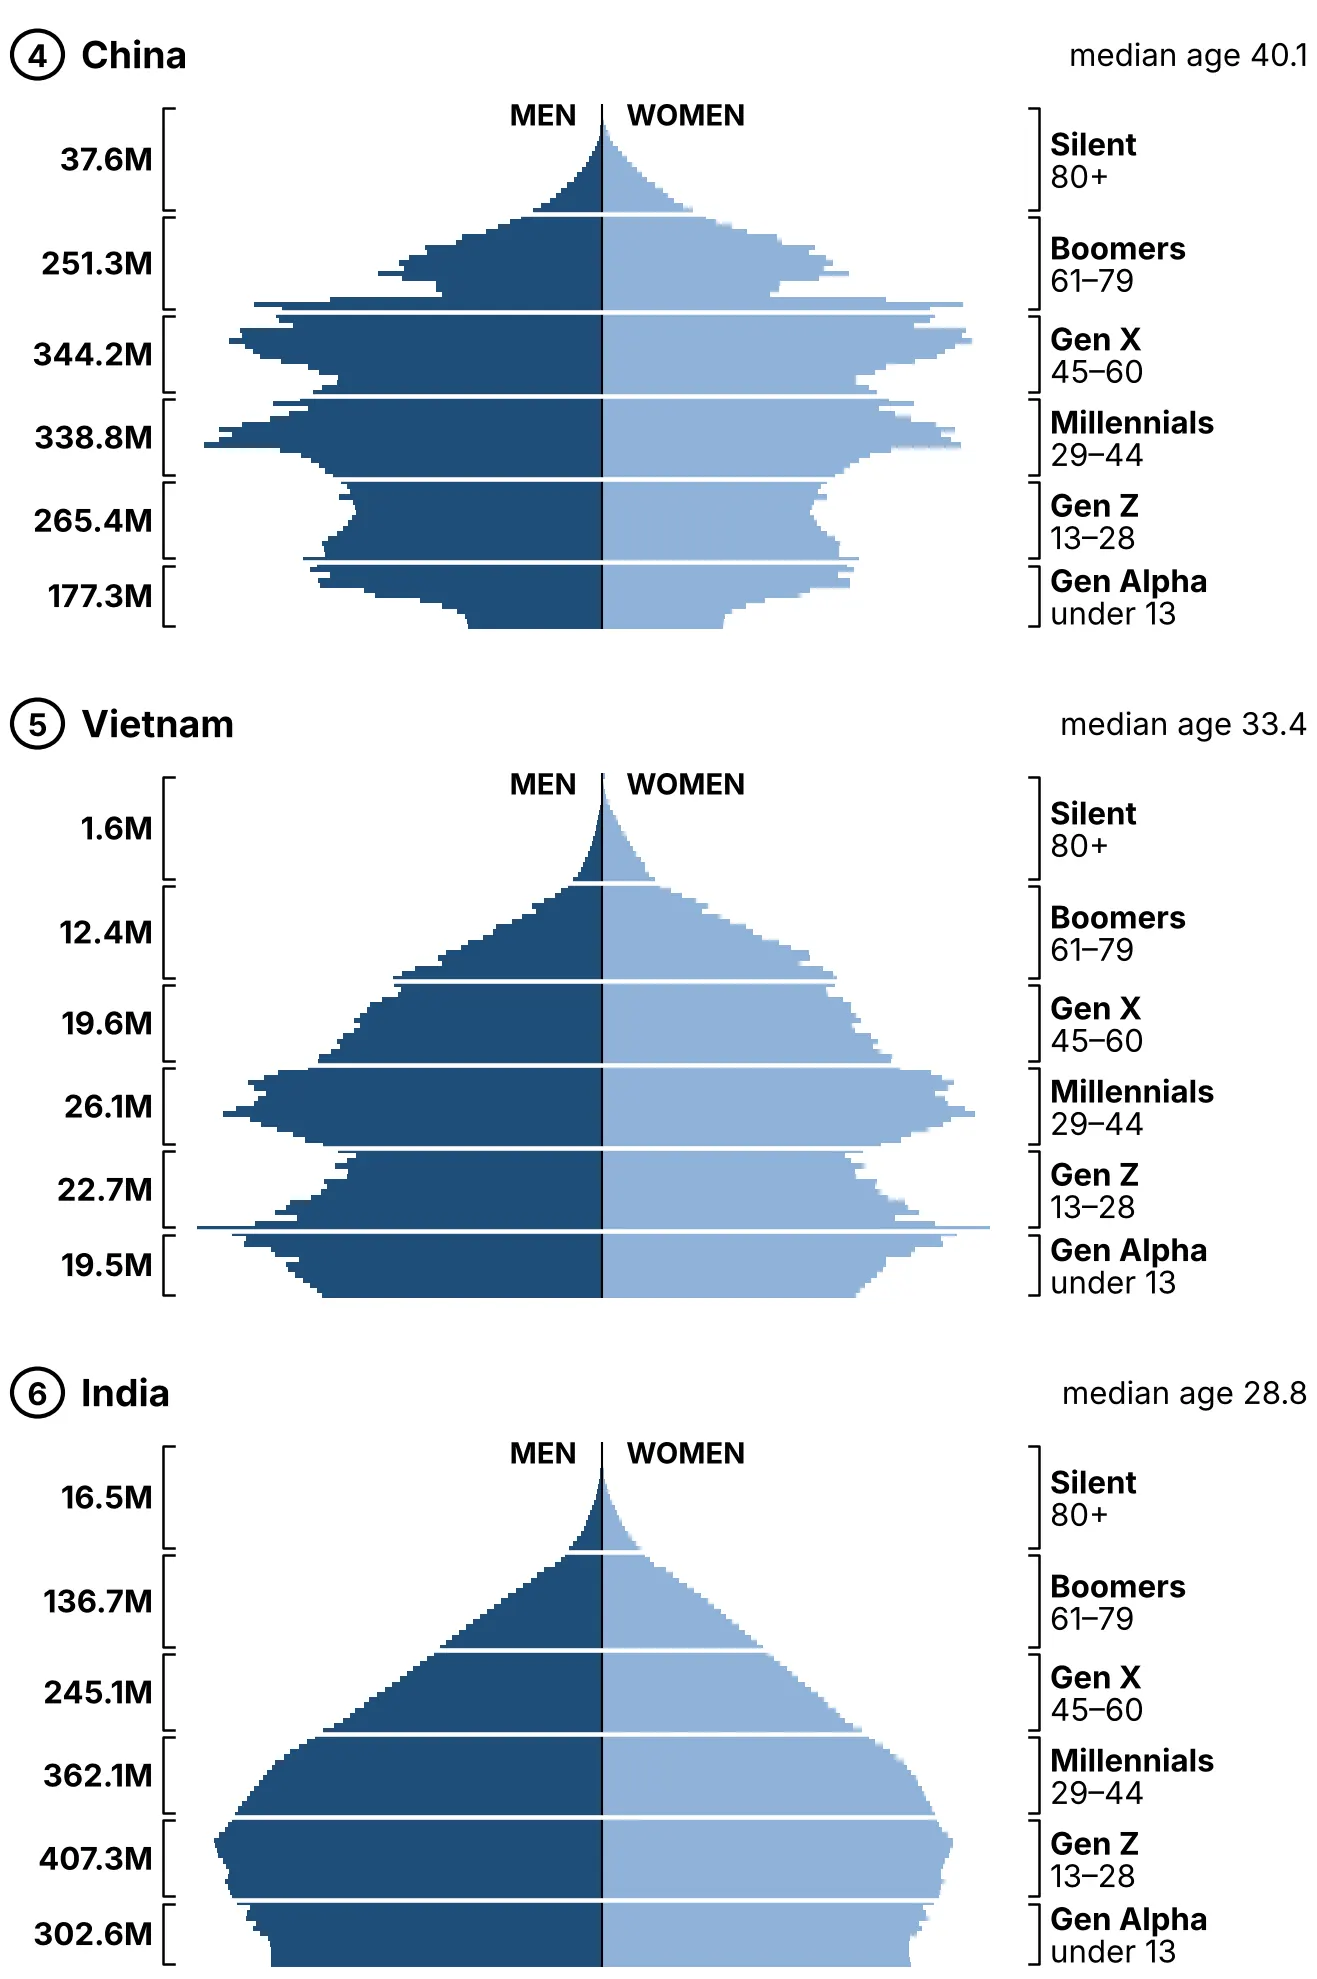
Mexico, 2025: the shape of a young country: chart from COS101D (Chapter 2 demographics).
Mexico, 2025: the shape of a young countryFigure 2.3Source: INEGI, Encuesta Intercensal 2025 (published September 22, 2026), population in private dwellings by five-year group and sex; each group spread over single years using the UN World Population Prospects 2024 age pattern for Mexico. Age not stated (18,589 people) left out.
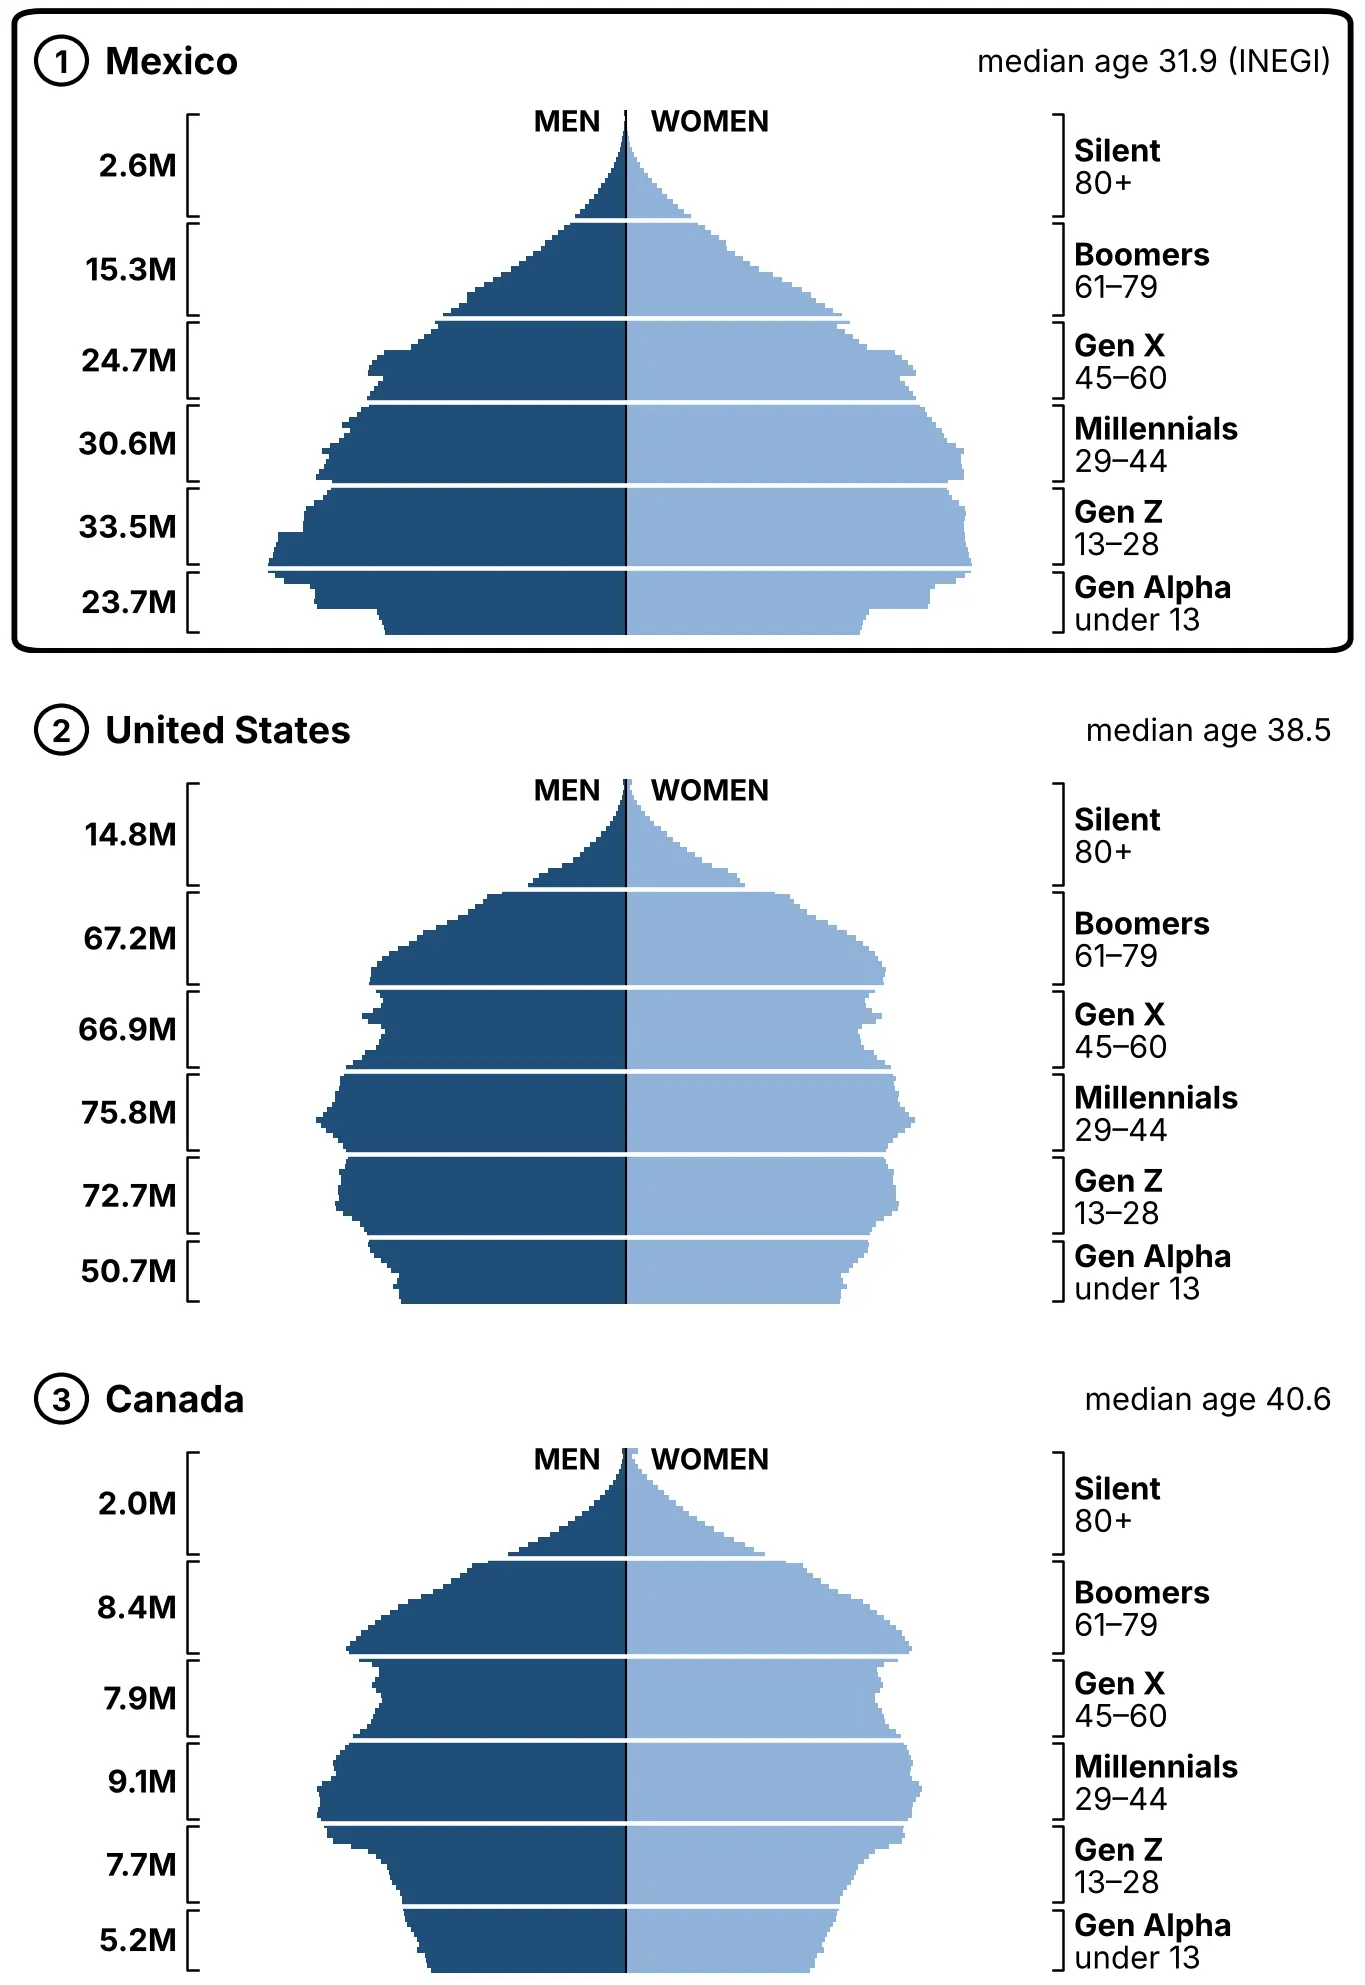
The Americas: Mexico and its two partners: chart from COS101D (Chapter 2 demographics).
The Americas: Mexico and its two partnersFigure 2.4Sources: Mexico, INEGI, Encuesta Intercensal 2025 (five-year groups spread over single years as in Figure 2.3; median age as published by INEGI). United States and Canada, UN World Population Prospects 2024, medium variant, July 1, 2025 (median age as published by the UN).
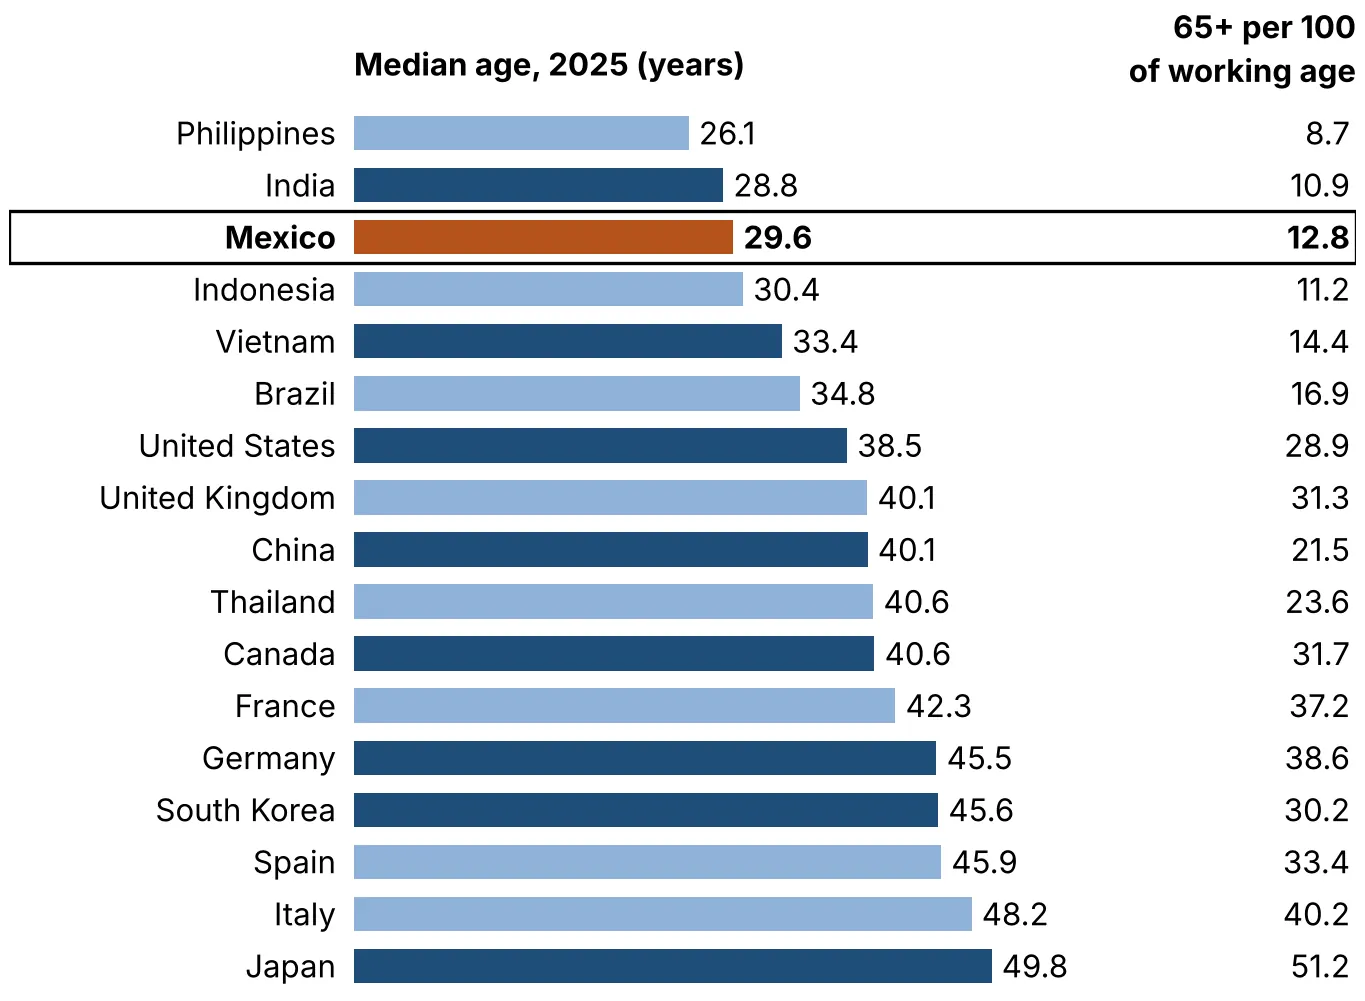
Mexico's rivals for the American factory: chart from COS101D (Chapter 2 demographics).
Mexico's rivals for the American factoryFigure 2.5Source: UN World Population Prospects 2024, medium variant, July 1, 2025 (median age as published by the UN; 65+ ratio calculated from its single-year data).
The old world: three countries turning upside down: chart from COS101D (Chapter 2 demographics).
The old world: three countries turning upside downFigure 2.6Source: UN World Population Prospects 2024, medium variant, July 1, 2025 (median age as published by the UN; 65+ ratio calculated from its single-year data).
Seventeen countries from youngest to oldest: chart from COS101D (Chapter 2 demographics).
Seventeen countries from youngest to oldestFigure 2.7Source: UN World Population Prospects 2024, medium variant, July 1, 2025 (median age as published by the UN; 65+ ratio calculated from its single-year data).
The window: when Mexico grows as old as the United States is today: chart from COS101D (Chapter 2 demographics).
The window: when Mexico grows as old as the United States is todayFigure 2.8Source: UN World Population Prospects 2024, medium-variant projections; ratio calculated from the UN's single-year data.
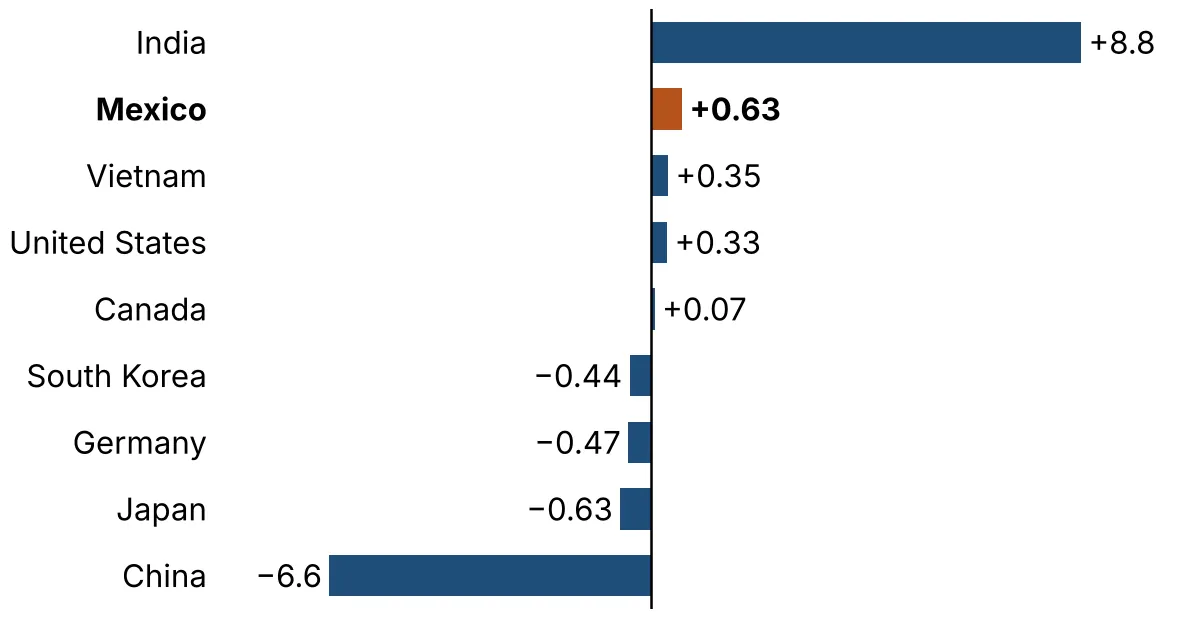
Workers added or lost each year: chart from COS101D (Chapter 2 demographics).
Workers added or lost each yearFigure 2.9Source: UN World Population Prospects 2024, medium-variant projections.
Where Mexico's young people live: chart from COS101D (Chapter 2 demographics).
Where Mexico's young people liveFigure 2.10Source: INEGI, Encuesta Intercensal 2025, tabulado Población 4 (median age, population in private dwellings). National median: 31.9. Outlines: Natural Earth (public domain).
Bar chart: average hourly pay in US dollars, US manufacturing against Mexico's IMSS wage and two Chinese ranges.
What an hour of work costsFigure 2.11Source: BLS, July 2026 (US); IMSS via PUED-UNAM, March 2026, 663 pesos a day for 7 days over a 48-hour week (Mexico); NBS 2024 annual wages over 2,000-2,400 hours (China).
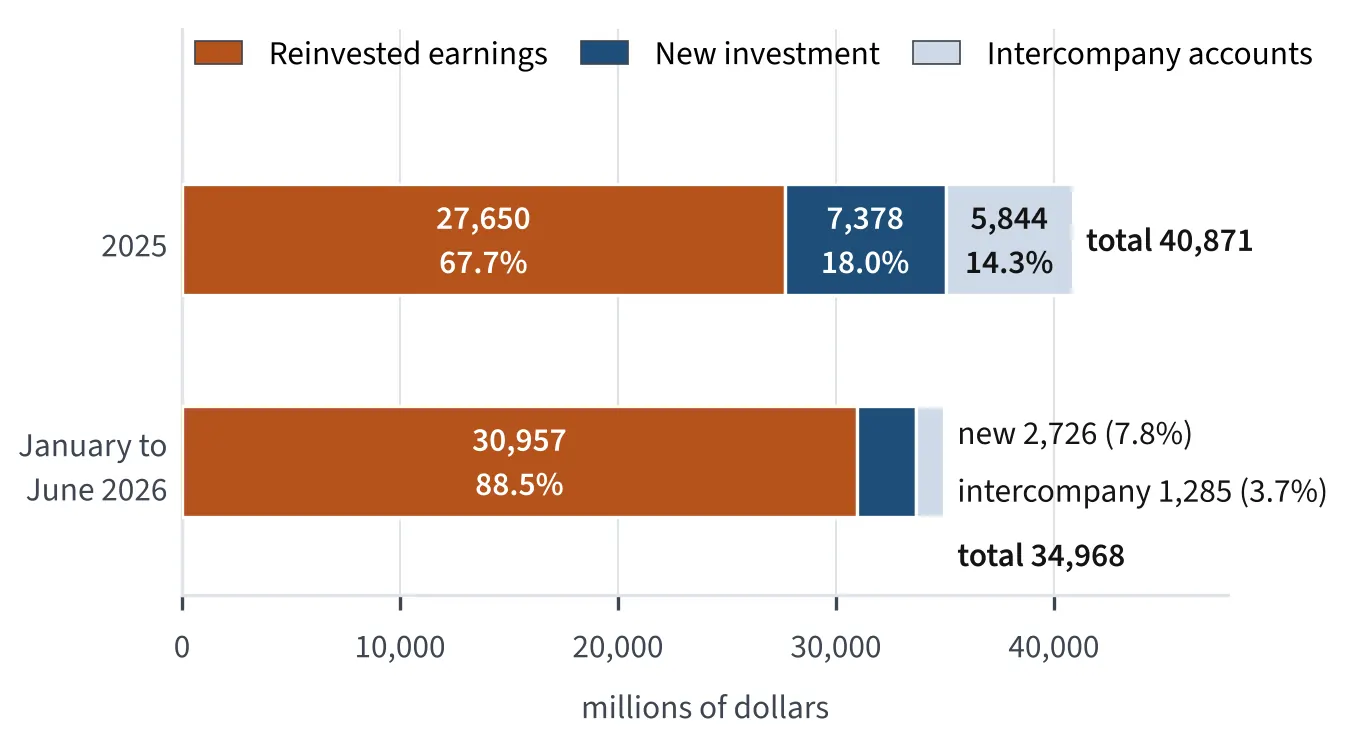
Stacked bar chart: FDI into Mexico by type, 2025 against first half 2026, reinvested earnings dominant.
Record investment, mostly reinvestedFigure 2.12Source: Secretaría de Economía, February 25, 2026 and August 26, 2026; Integralia (announcements, January 2023 to June 2025); Economy Secretary Marcelo Ebrard, September 2026.
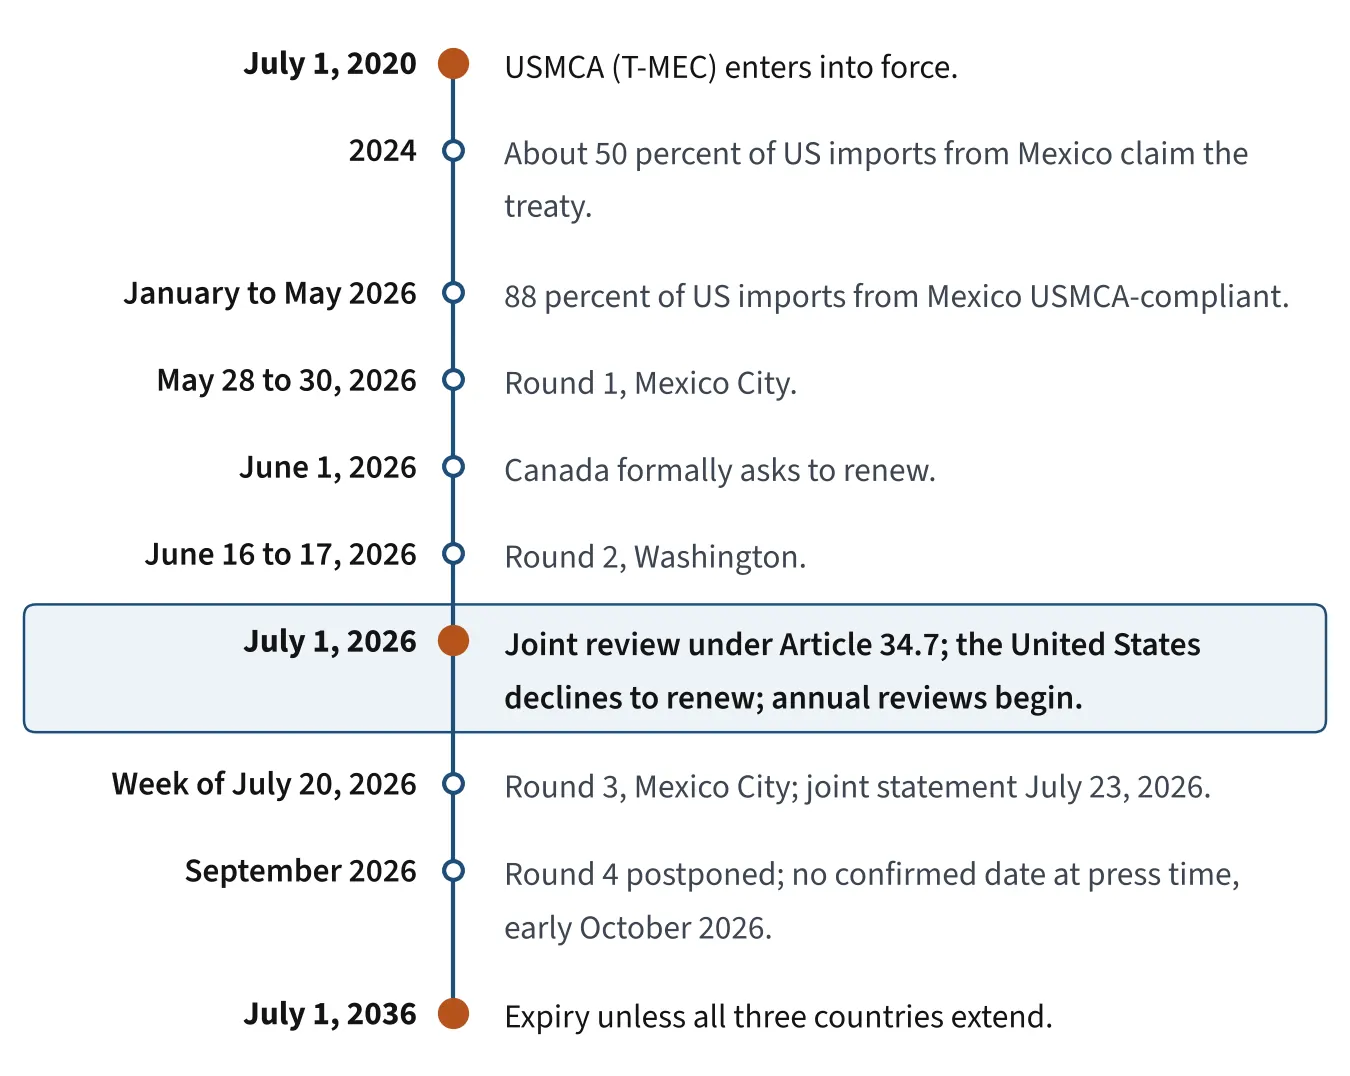
Timeline of the USMCA from entry into force in 2020 to expiry in 2036, with the 2026 review and rounds.
The treaty's calendarFigure 3.1Source: White & Case, July 2, 2026; USTR joint statement, July 23, 2026; CRS IF11175, August 13, 2026; Ecosistema Startup, September 24, 2026; Posta, September 24, 2026; Infobae, October 1, 2026.
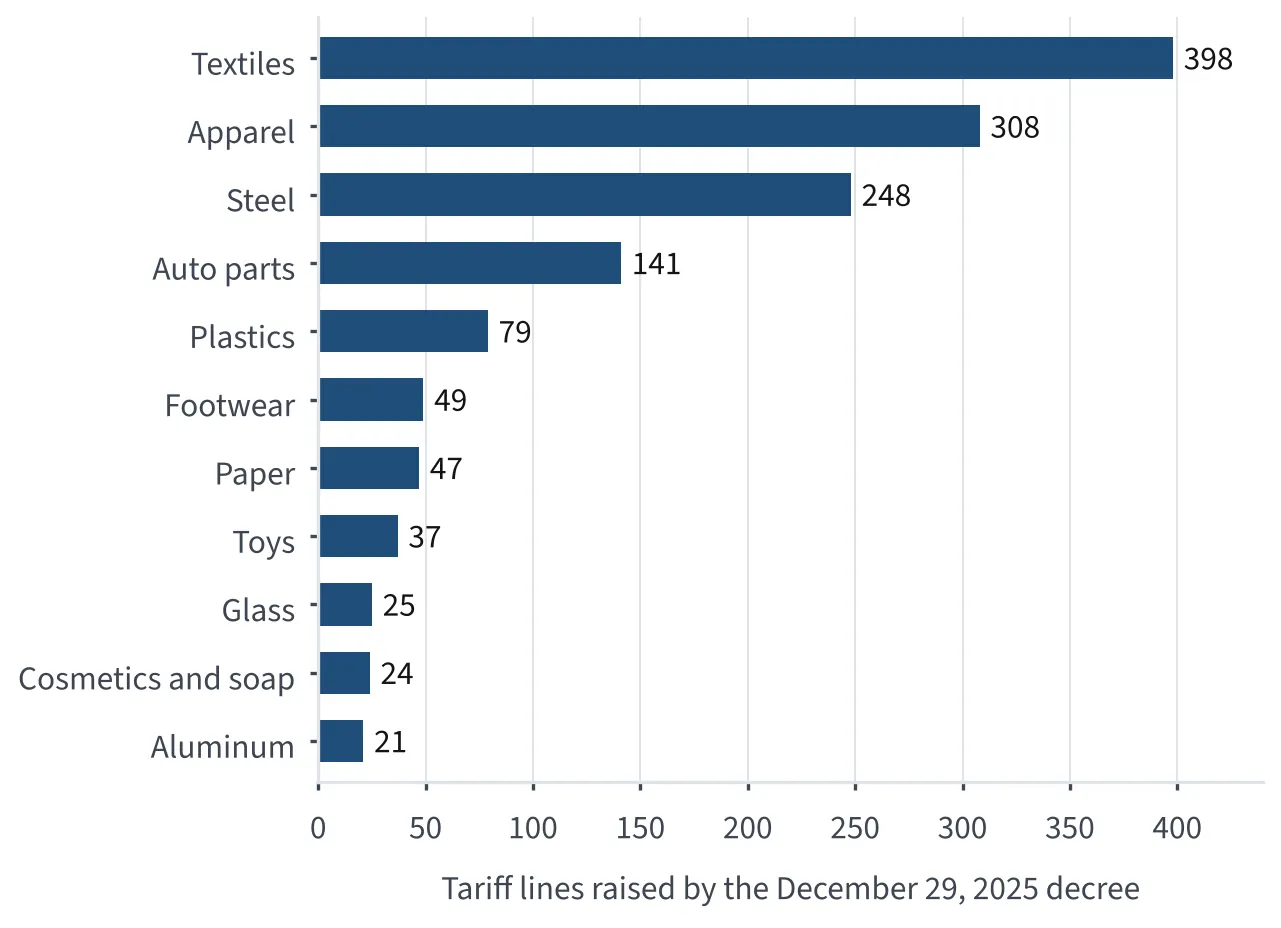
Bar chart: number of tariff lines raised by the December 29, 2025 decree, by sector, textiles highest.
Mexico's 2026 tariff wallFigure 3.2Source: DOF, December 29, 2025 and April 23, 2026; Galicia Abogados; Alvarez & Marsal via Mondaq, February 3, 2026; Joffroy LIGIE 2026 catalog; Expansión, August 14, 2025.
Three stacked boxes: three paths from a US warehouse to a Mexican buyer and what each does to treaty origin and duty.
Origin follows the goodsFigure 3.3Source: USMCA Art. 4.2 and 4.18; CPTPP Art. 3.18; Japan-Mexico EPA Art. 35 and art. 39A; EU-Mexico Decision 2/2000 (Annex III), Regla 1.3, DOF December 31, 2002; 19 CFR 144.5; Global Affairs Canada guidance; HMRC guidance, June 19, 2023.
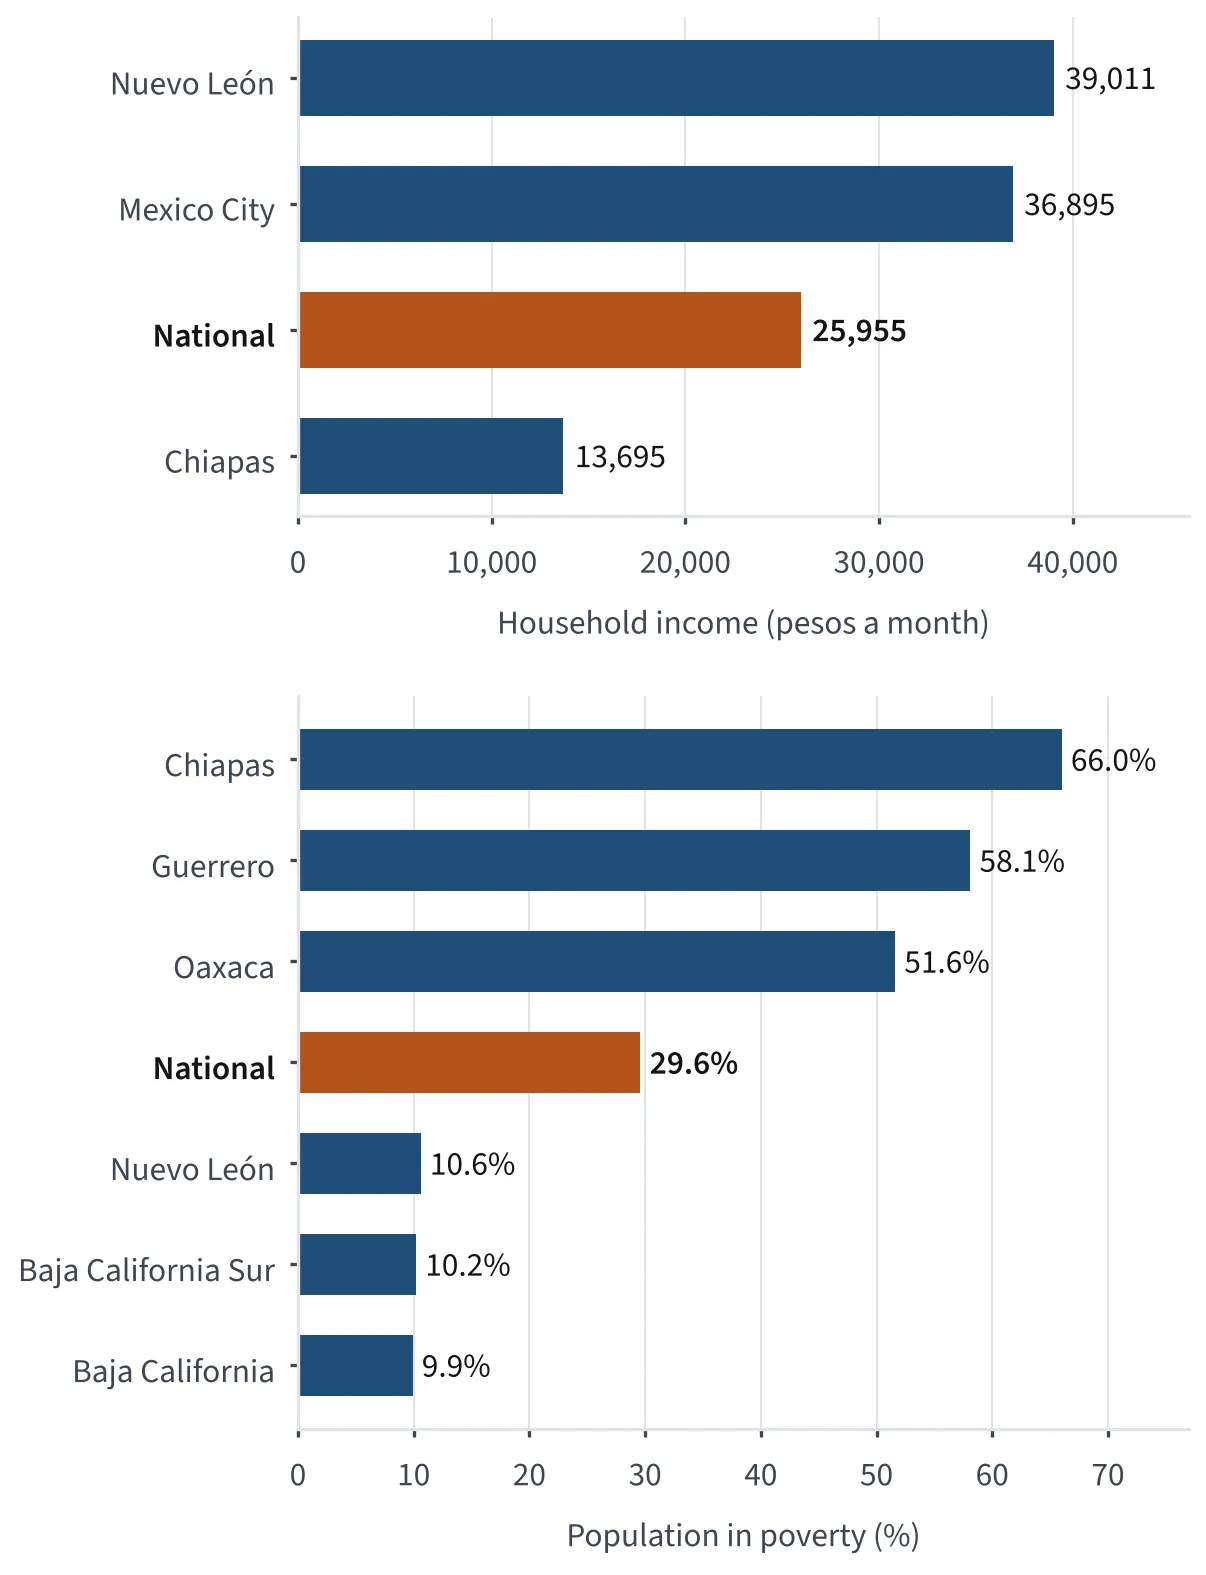
Two bar charts: household income per month and share of people in poverty, selected states against the national figure.
Two ends of one countryFigure 4.1Source: INEGI ENIGH 2024; INEGI multidimensional poverty measure 2024.
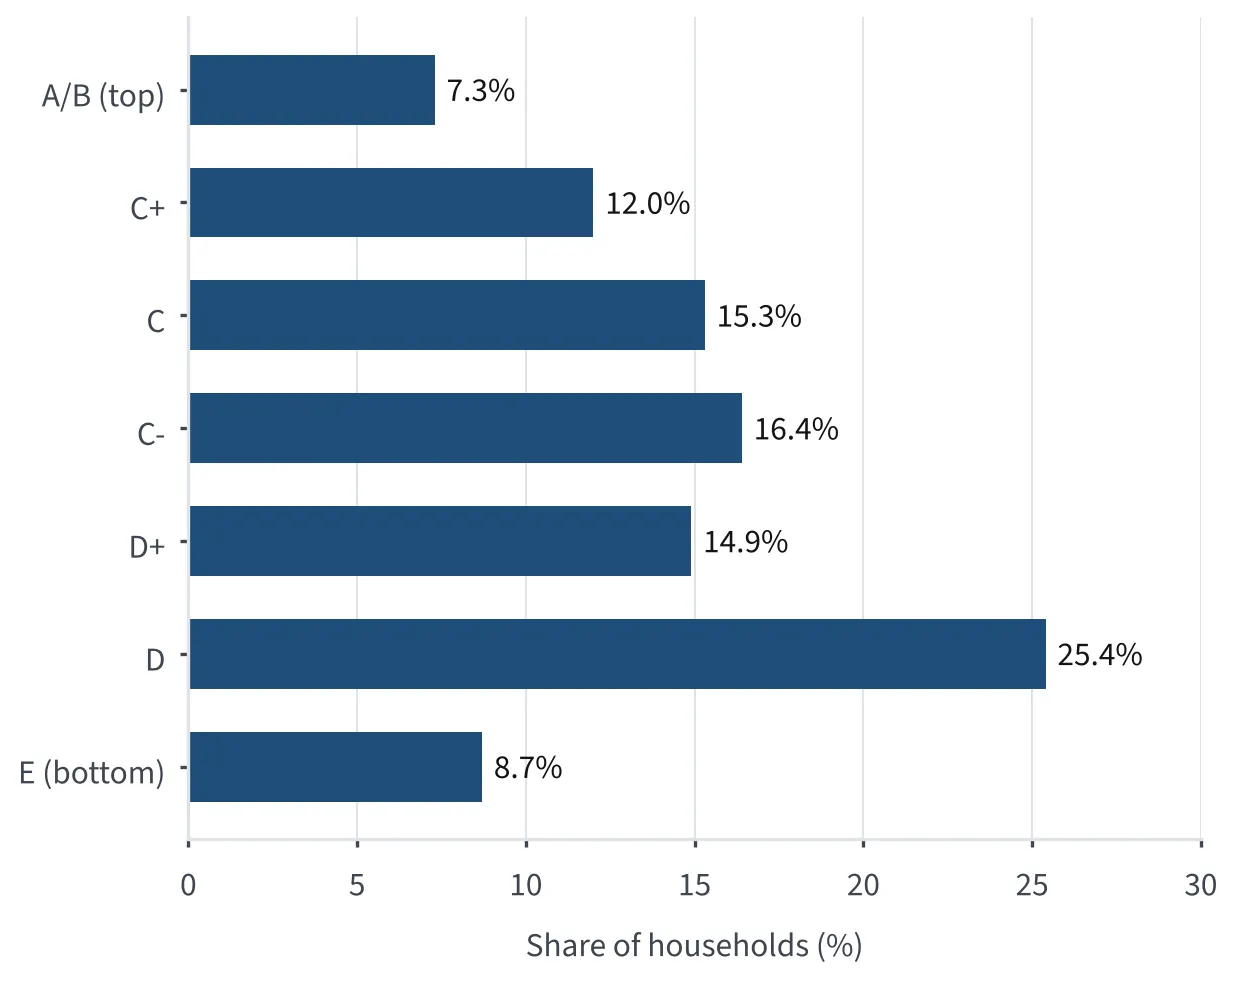
Bar chart: share of Mexican households at each AMAI socioeconomic level, A/B to E.
Mexico's socioeconomic ladderFigure 4.2Source: AMAI NSE rule applied to INEGI ENIGH 2022.
Paired bar chart: share of household cash spending by category, Mexico 2024 against the United States.
Where the household budget goesFigure 4.3Source: INEGI ENIGH 2024; US Bureau of Labor Statistics Consumer Expenditure Survey.
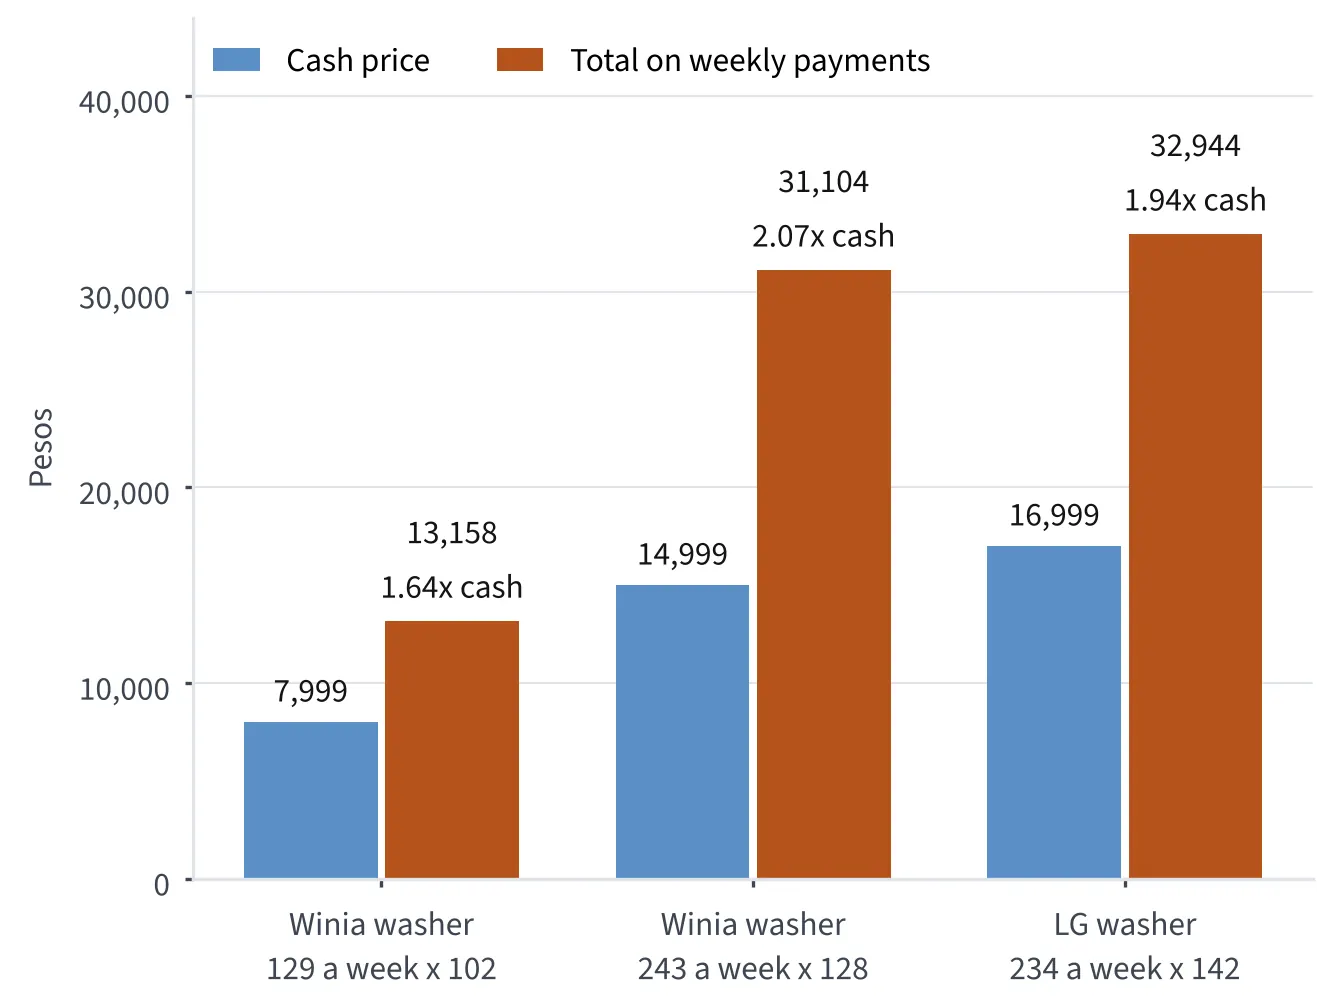
Grouped bar chart: cash price against total paid on weekly installments for three washing machines.
Cash price against weekly paymentsFigure 4.4Source: Elektra listings as reported by Datanoticias, June 20, 2022; CONDUSEF warning via El Imparcial, February 28, 2026.
Two bar charts: CAT of ten Mexican credit products, and Banxico's average effective card rate by bank.
What Mexican credit costsFigure 4.5Source: Liverpool CAT table, December 2025; El Imparcial, September 11, 2024 and July 21, 2024; financera.mx; bbva.mx; bancario.com.mx; Plata booklet; Banxico (June 2025).
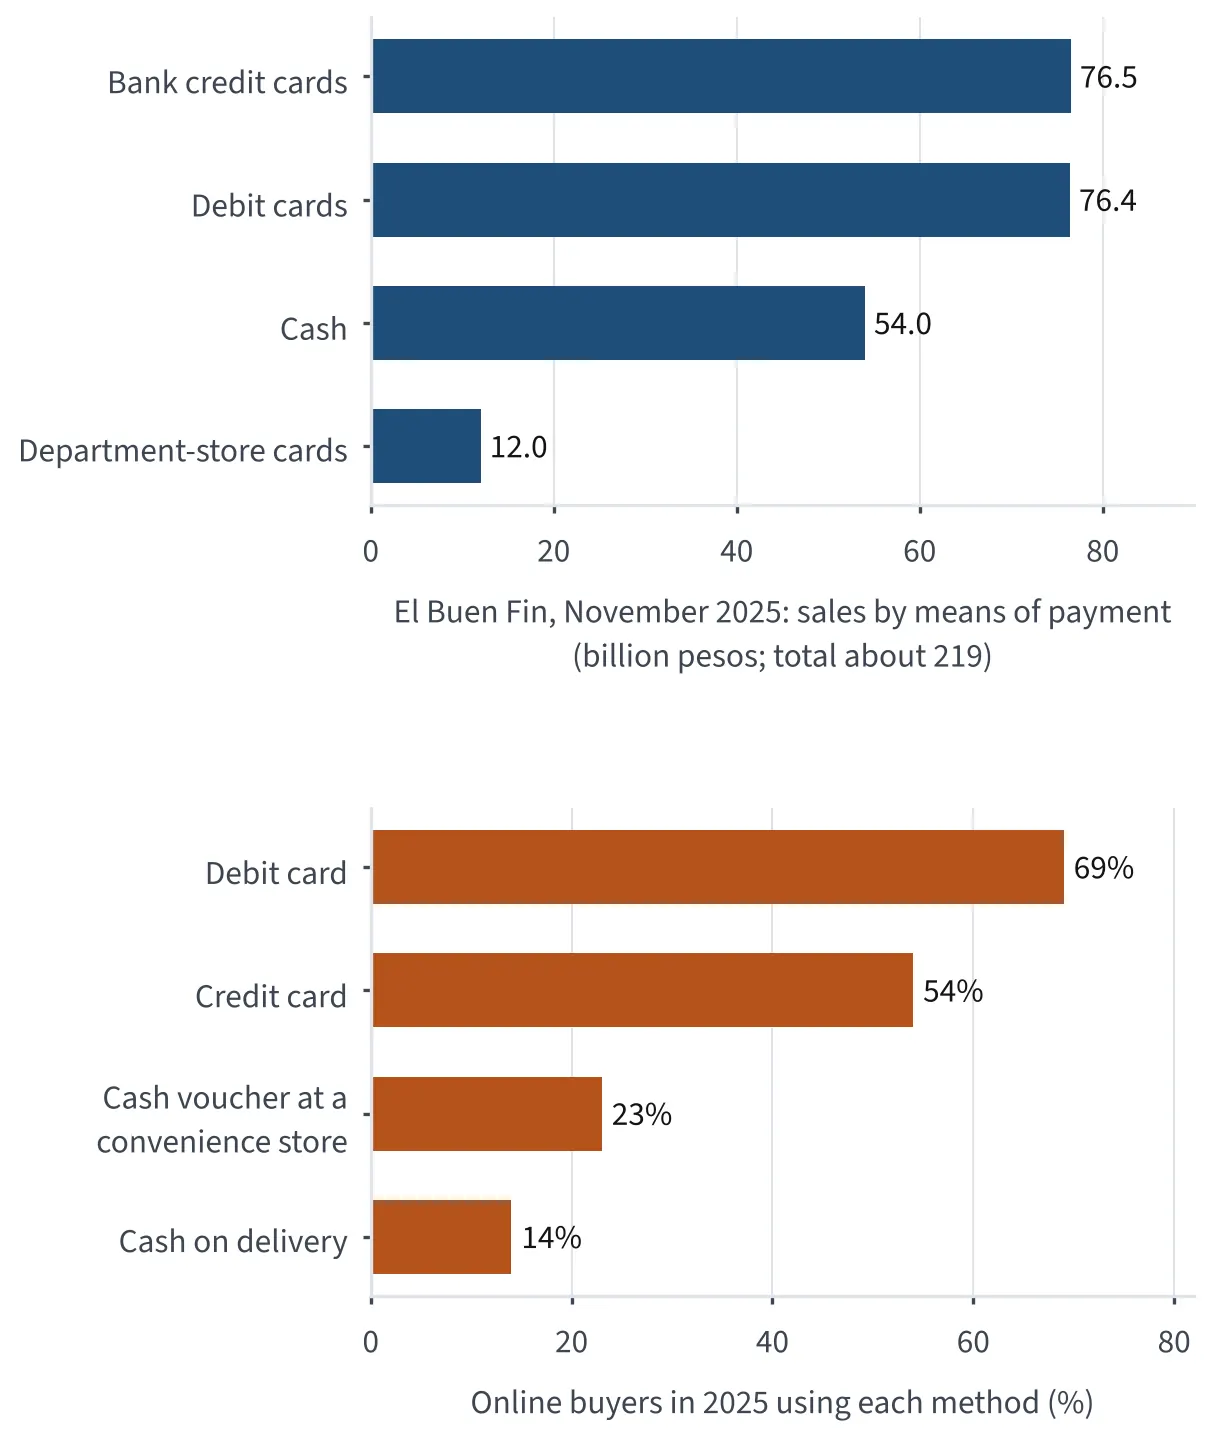
Two bar charts: El Buen Fin 2025 sales by means of payment, and payment methods used by online buyers.
How Mexico paid for El Buen FinFigure 4.6Source: Government of Mexico, El Buen Fin 2025 report; AMVO Estudio de Venta Online 2026.
Bar chart, log scale: stores per million people in Mexico by format and chain, with AutoZone US as reference.
Stores per million people, Mexico 2026Figure 5.1Source: INEGI DENUE 2023 and 2026 (page updated September 2026); FEMSA, June 30, 2026; company reports (Similares December 2023, Guadalajara 2024, Benavides June 2026, AutoZone August 29, 2026).
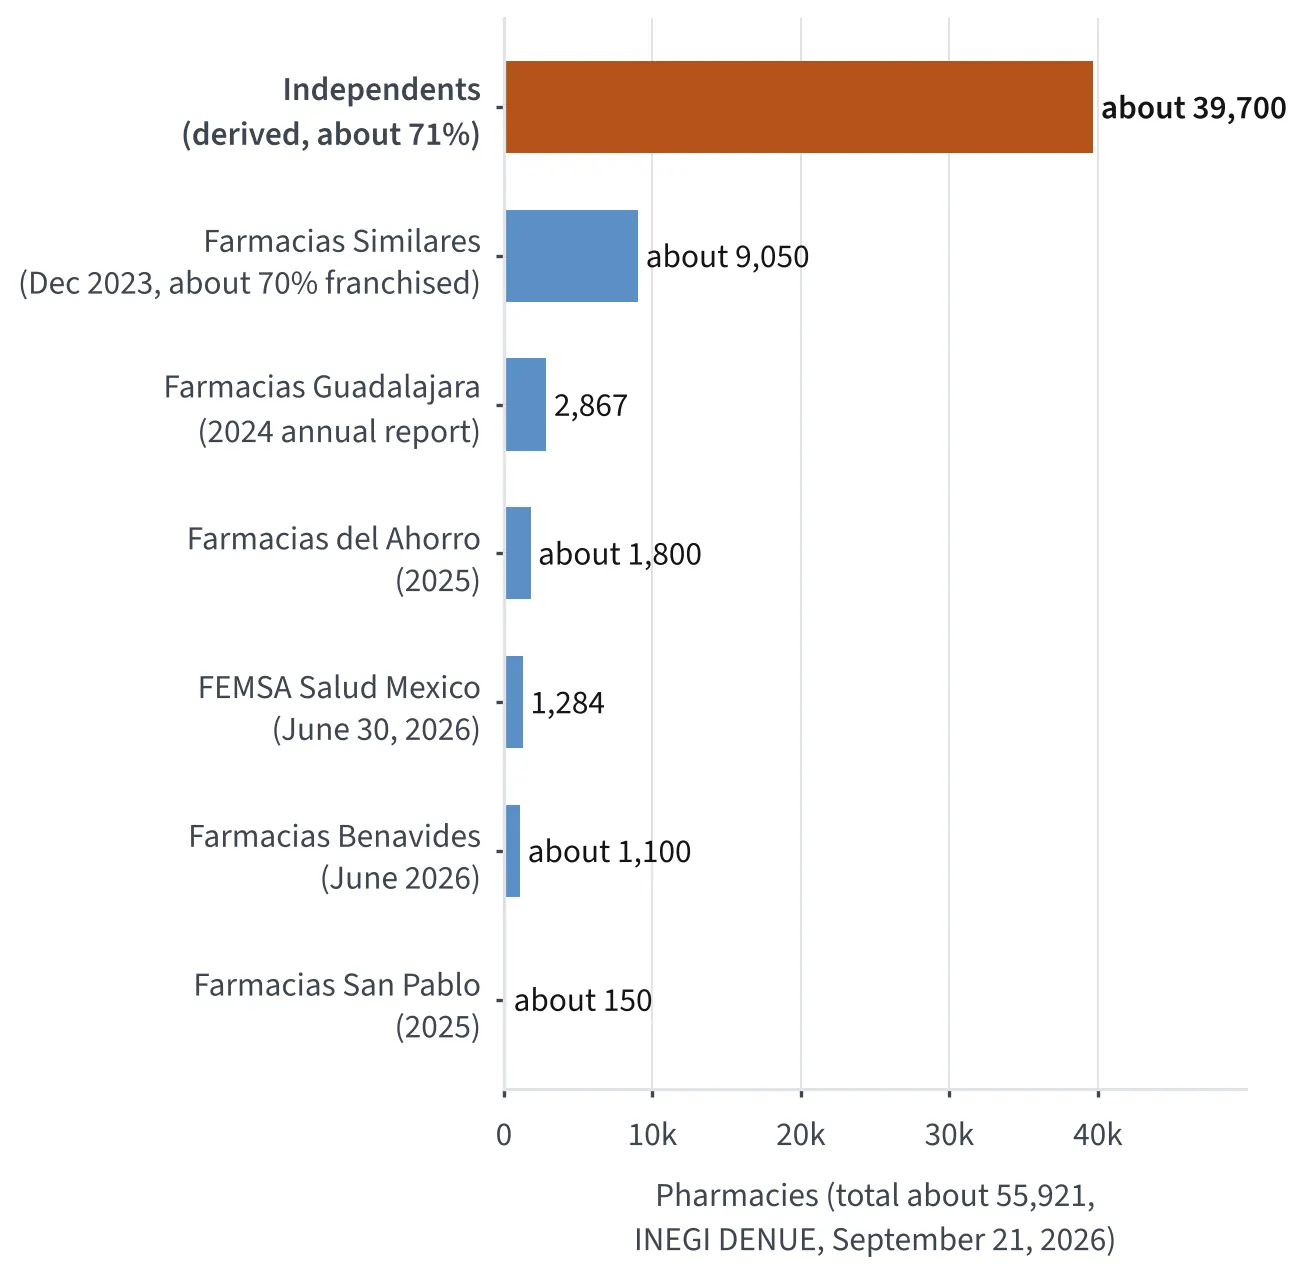
Bar chart: number of Mexican pharmacies by owner, independents against six main chains.
Mexico's pharmacy map, chains against independentsFigure 5.2Source: INEGI DENUE, page updated September 21, 2026; company reports (dates as labeled); Datia, July 2026.
Bar chart: points of sale reached by Coca-Cola FEMSA and GEPP, against tienditas and OXXO stores.
Who reaches the corner shopFigure 5.3Source: Coca-Cola FEMSA 4Q25 release, February 24, 2026; PepsiCo release, July 18, 2011 (GEPP); INEGI DENUE 2023; FEMSA, June 30, 2026; Grupo Bimbo company page, LTM 2Q26.
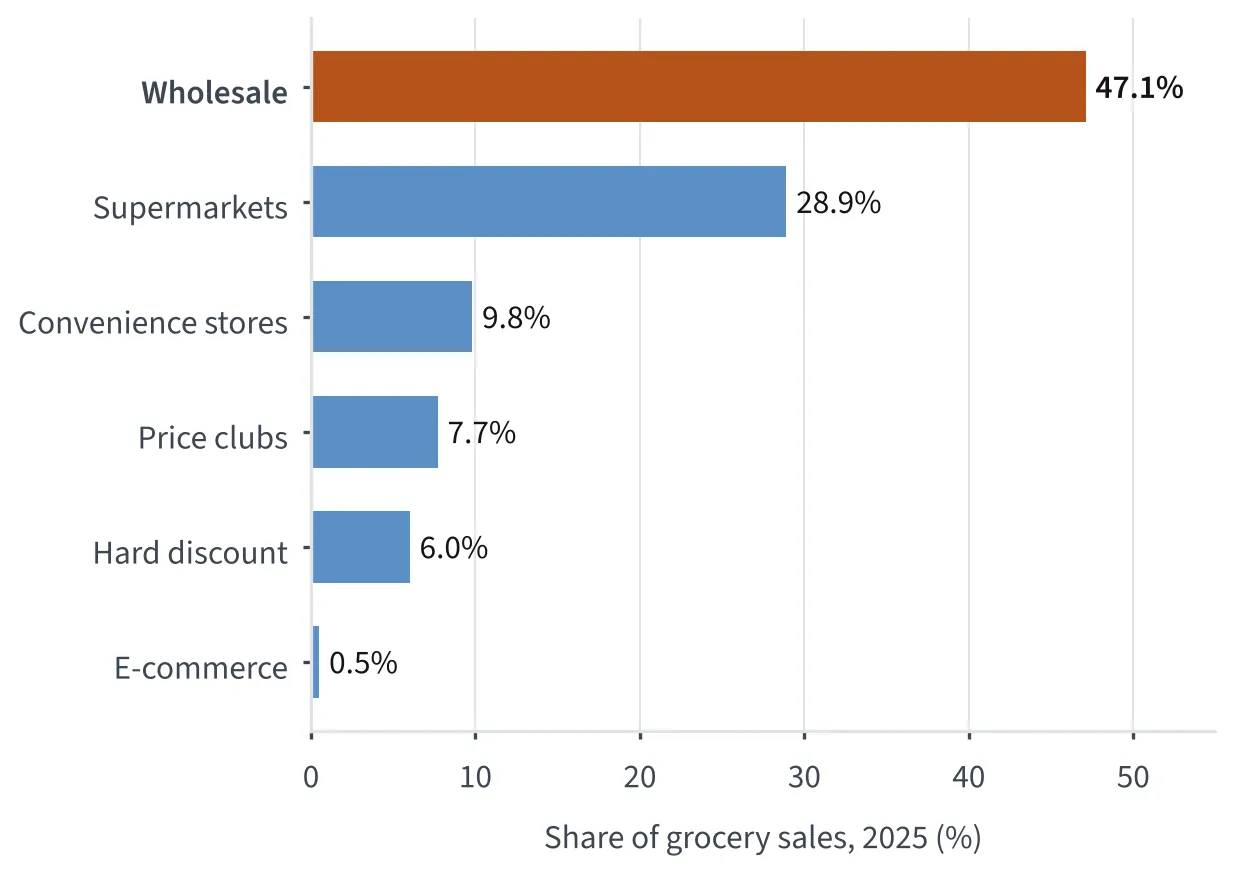
Bar chart: share of Mexican grocery sales by channel in 2025, wholesale largest.
Where Mexico buys its groceries, 2025Figure 5.4Source: ISCAM data for 2025, reported June 2026; Banco de México, 2023 data, published March 2024.
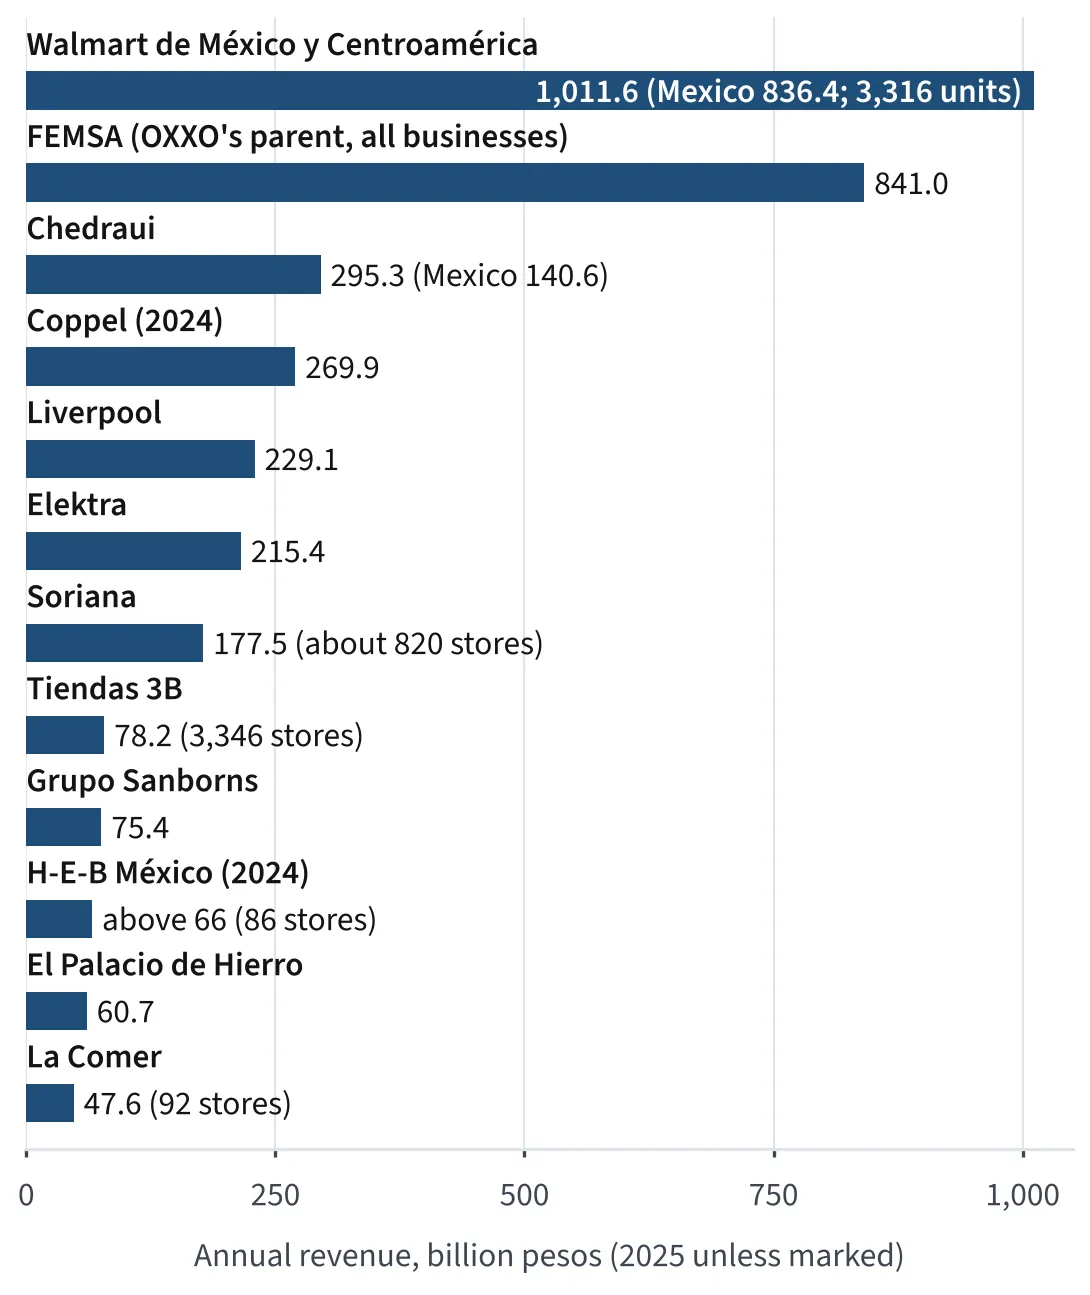
Horizontal bar chart: annual revenue of twelve Mexican retail chains, billion pesos, Walmart de México first.
Mexico's leading chains by revenueFigure 6.1Source: Walmart de México 4Q25 release, February 18, 2026; company reports for 2025; Expansión (Coppel, 2024); H-E-B México, 2024.
Paired bar chart: Walmart de México units in Mexico by format, December 31, 2025, against June 30, 2026.
Walmart de México's formats in MexicoFigure 6.2Source: Walmart de México 4Q25 release (December 31, 2025); Walmart corporate page (June 30, 2026).
Horizontal bar chart: store counts of nine convenience and discount chains in Mexico, OXXO far ahead.
Convenience and discount chains by store count, Mexico 2026Figure 6.3Source: FEMSA, June 30, 2026; Heineken México, August 2026; Tiendas 3B, Q2 2026; Iconn, April 2026; Expansión, December 2025; company counts March to April 2026.
Bar chart: days payable at Soriana, Walmart de México and Chedraui, against market practice, average terms and a proposed cap.
How long Mexico's grocers take to payFigure 6.5Source: Company financial statements, FY2025 (author's calculation, consolidated figures); Cemefi; Coface, 2024 data; Gaceta Parlamentaria, February 8, 2024.
Illustrative waterfall from gross invoice to cash received, above a bar chart of days payable at three grocers.
From invoice to cash at a Mexican chainFigure 6.6Source: Supplier advisers as quoted in the press; Walmex supplier-agreement system fields; COFECE retail study 2020; COFECE resolution against Walmex, December 2024. Days payable computed from 2025 statements.
Horizontal bar chart: share of Mexican online shoppers using eight platforms; Amazon and Mercado Libre lead.
Where Mexican online shoppers buyFigure 7.1Source: Statista survey via El CEO, January 11, 2025 (multiple answers). Context: COFECE preliminary opinion IEBC-001-2022, February 2024; AMVO, Estudio de Venta Online 2026.
Step chart: courier rate by declared value, US or Canada origin against no-agreement origins.
What a parcel pays at the Mexican border, 2026Figure 7.4Source: DOF, July 28, 2025, rule 3.7.35, in force August 15, 2025; SAT Cuarta Resolución RGCE 2025; IDC Online, July 30, 2025; Baker McKenzie, July 29, 2025; Expansión, August 14, 2025; Alvarez & Marsal, 2026; Economy Ministry rule 2.4.11 fr. IX (Acuerdo modificatorio, May 21, 2026, SIDOF; CJ Aduanero, June 1, 2022); Trade Law College, January 13, 2025.
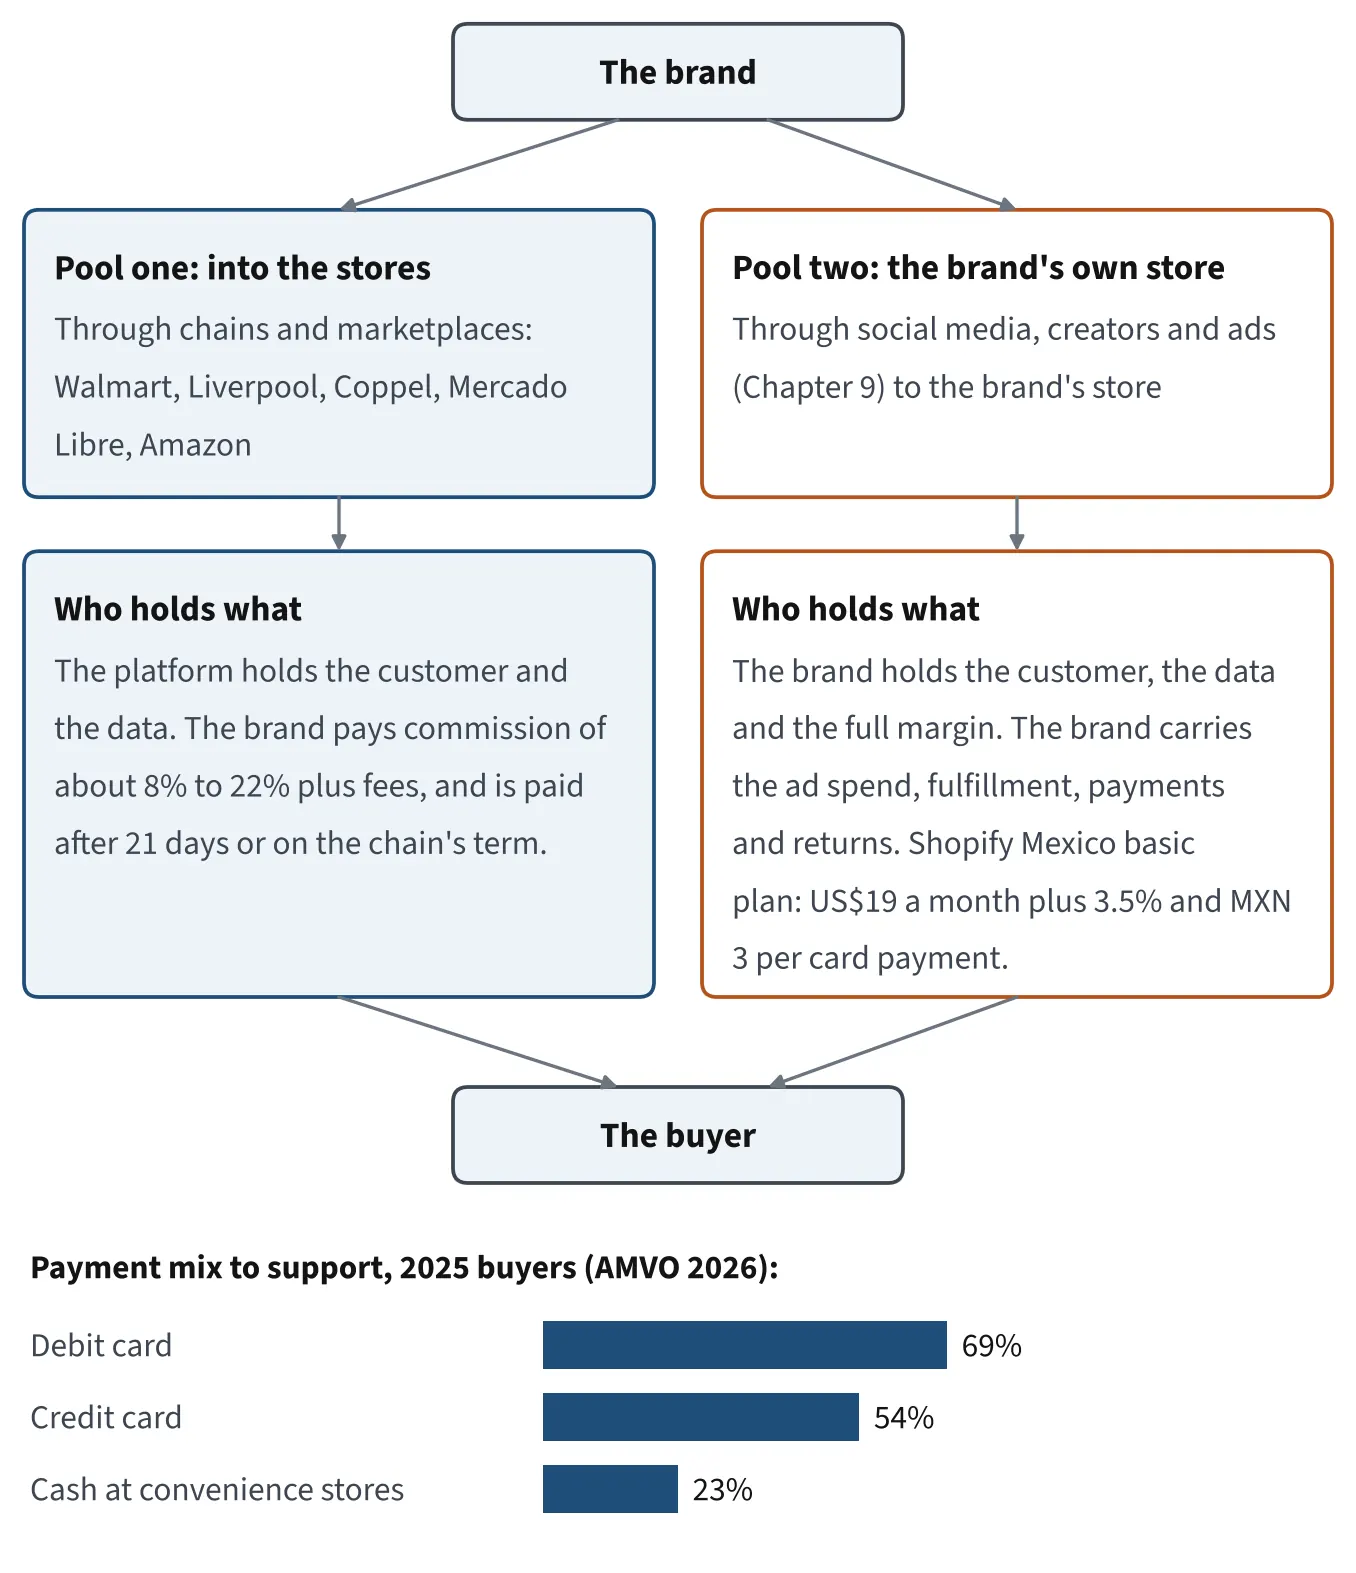
Branch diagram: brand to buyer through the stores or the brand's own store, with a bar chart of the payment mix.
The two poolsFigure 7.5Source: Author's synthesis; Shopify Mexico pricing; AMVO 2026 (payment mix of 2025 buyers).
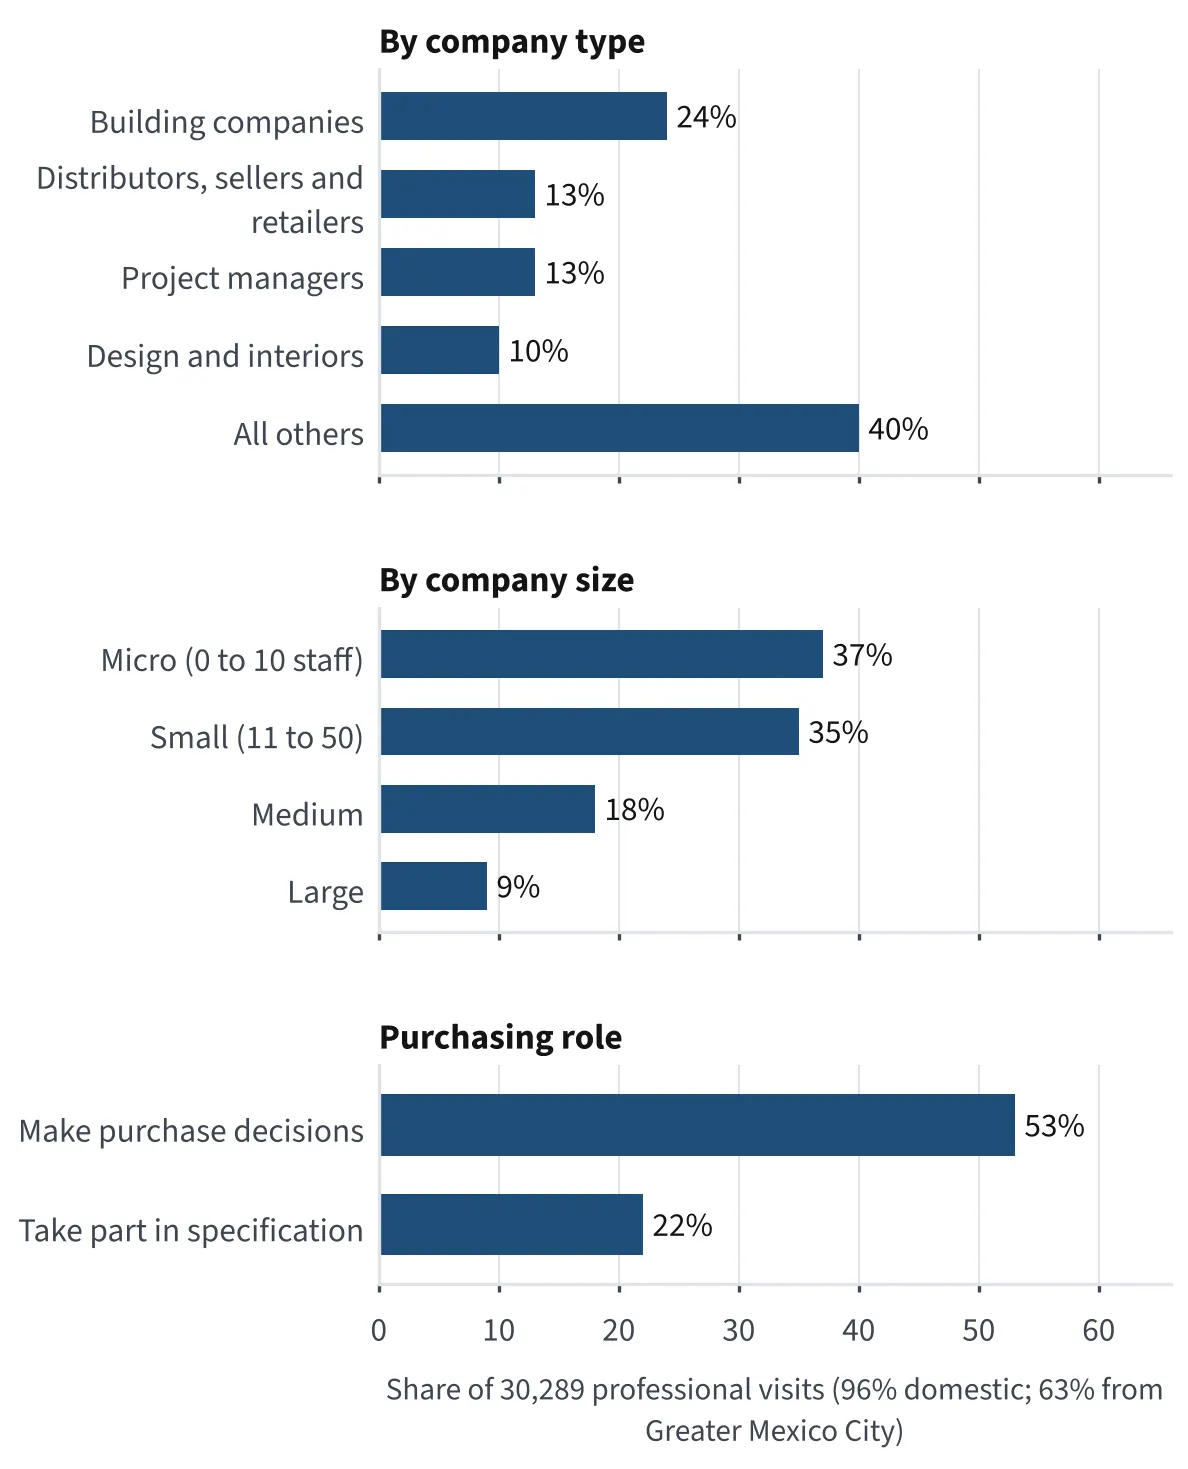
Three bar charts: shares of Expo CIHAC 2019 visits by company type, company size and purchasing role.
Who walked the floor at Expo CIHAC, 2019Figure 8.2Source: Bayern International, Expo CIHAC visitor structure 2019.
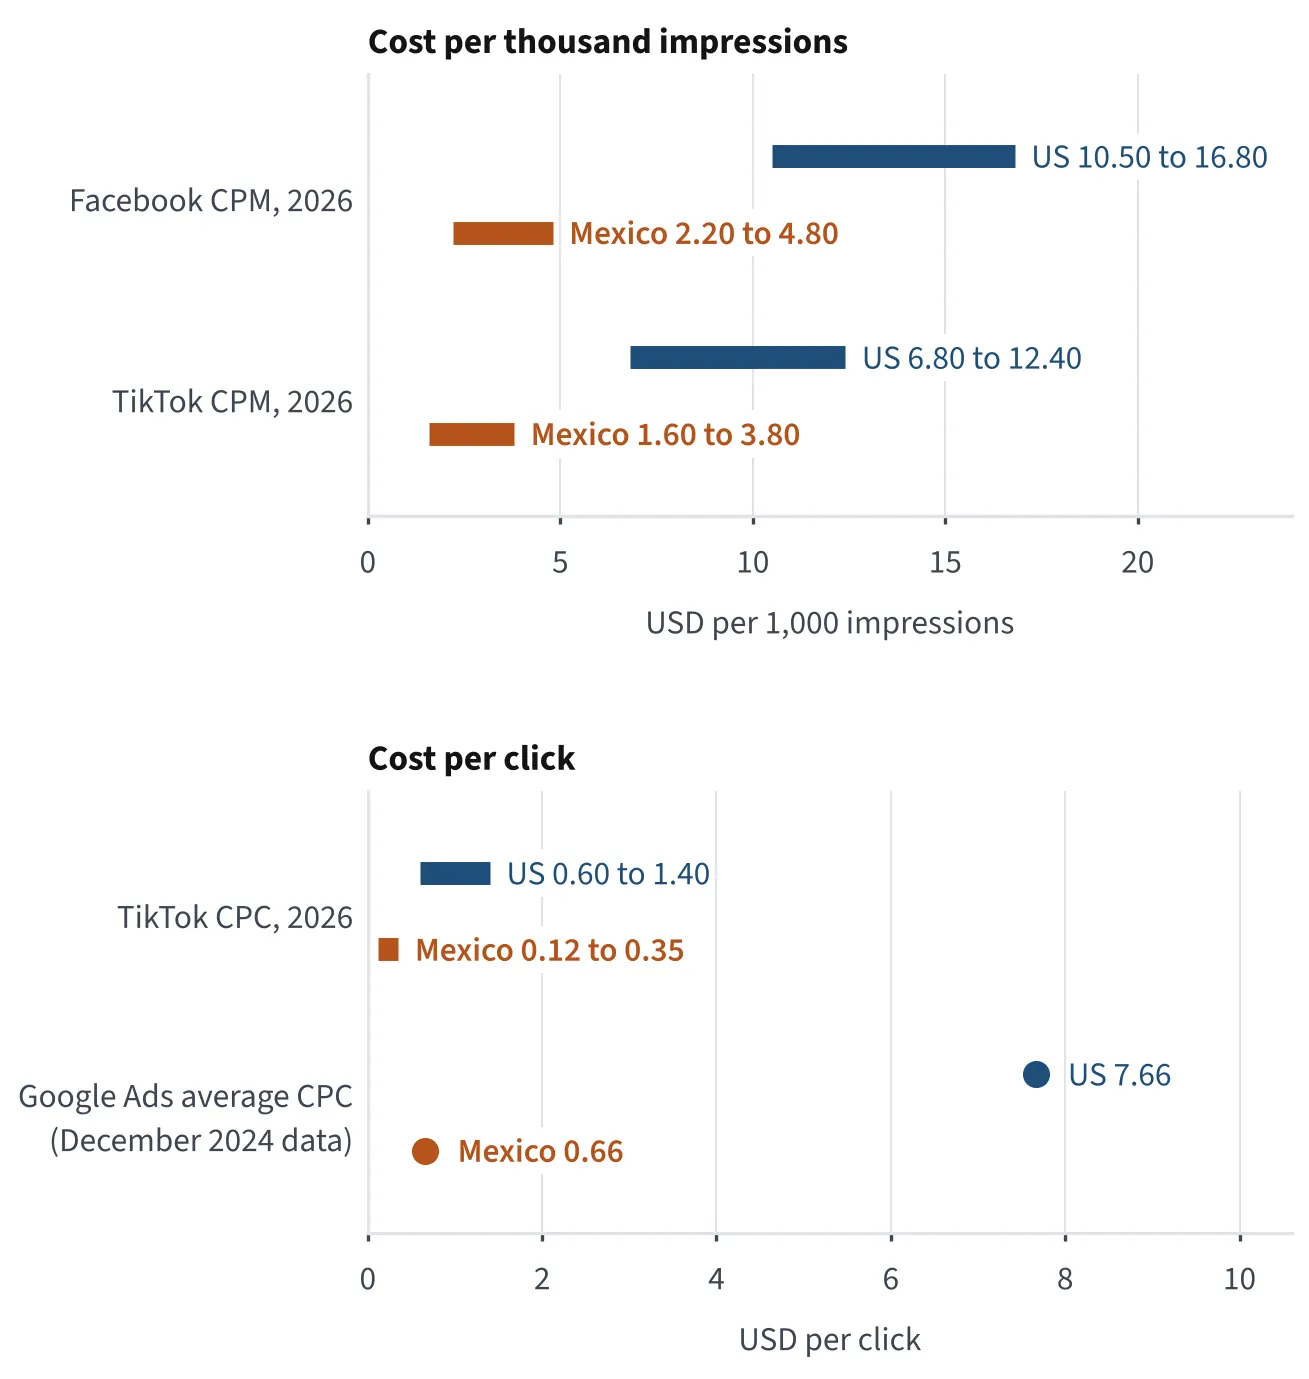
Two range charts: ad cost per thousand impressions and per click, Mexico against the US, by platform.
What attention costs, Mexico against the United StatesFigure 9.1Source: Stackmatix, September 6, 2026 (Facebook and TikTok, 2026); Statista/Semrush, December 2024 data, via Merca2.0, May 19, 2025, and América Retail, May 29, 2025 (Google Ads).
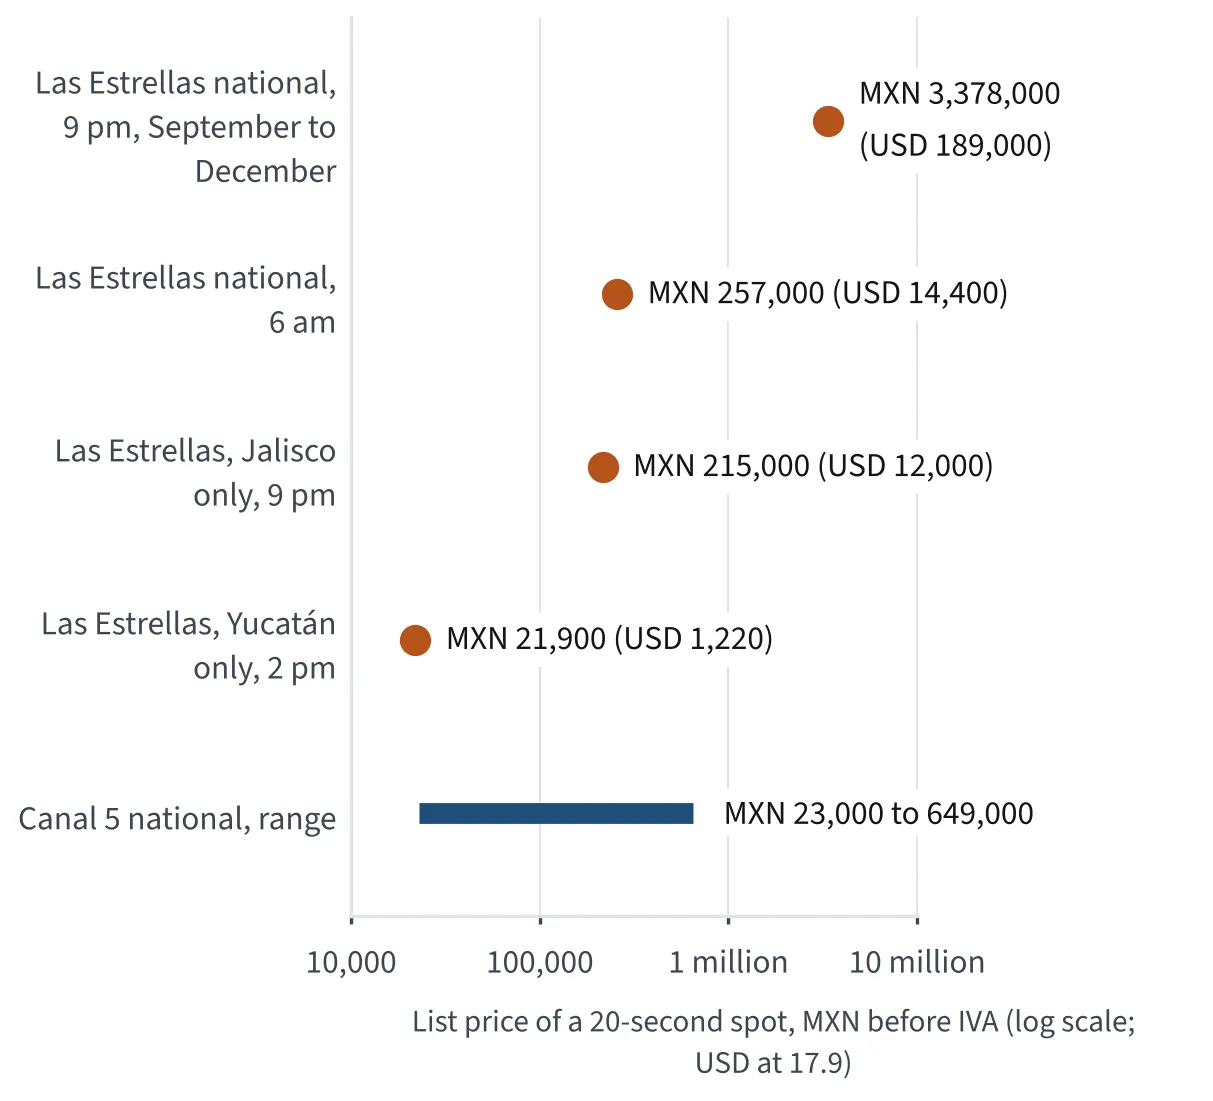
Dot chart on a log scale: Televisa list prices for a 20-second spot by channel, region and hour, with the Canal 5 range.
The price of twenty seconds on Mexican television, 2026Figure 9.2Source: Televisa 2026 commercial reference rates, read October 2026. Prices before IVA; USD at 17.9.
Grouped bar chart: Instagram followers of 19 Mexican public figures, by generation (Gen X, Millennial, Gen Z).
Mexican faces by generation, October 2026Figure 9.3Source: Social Blade, fetched October 7, 2026; Heepsy Mexico ranking, October 1, 2026 (Thalía, Angelique Boyer); birth years from English Wikipedia, read October 7, 2026.
Bar chart: sales force of Betterware (with Jafra), Price Shoes and Natura and Avon, latest year for each.
Mexico's catalog sellers, latest figuresFigure 9.4Source: BeFra Q4 2025 release, February 26, 2026; Expansión, August 28, 2024; Expansión, July 14, 2025; Reforma, June 9, 2026; El CEO, April 22, 2024; catalogosmx.moda, October 2025; Xataka México (Tupperware).
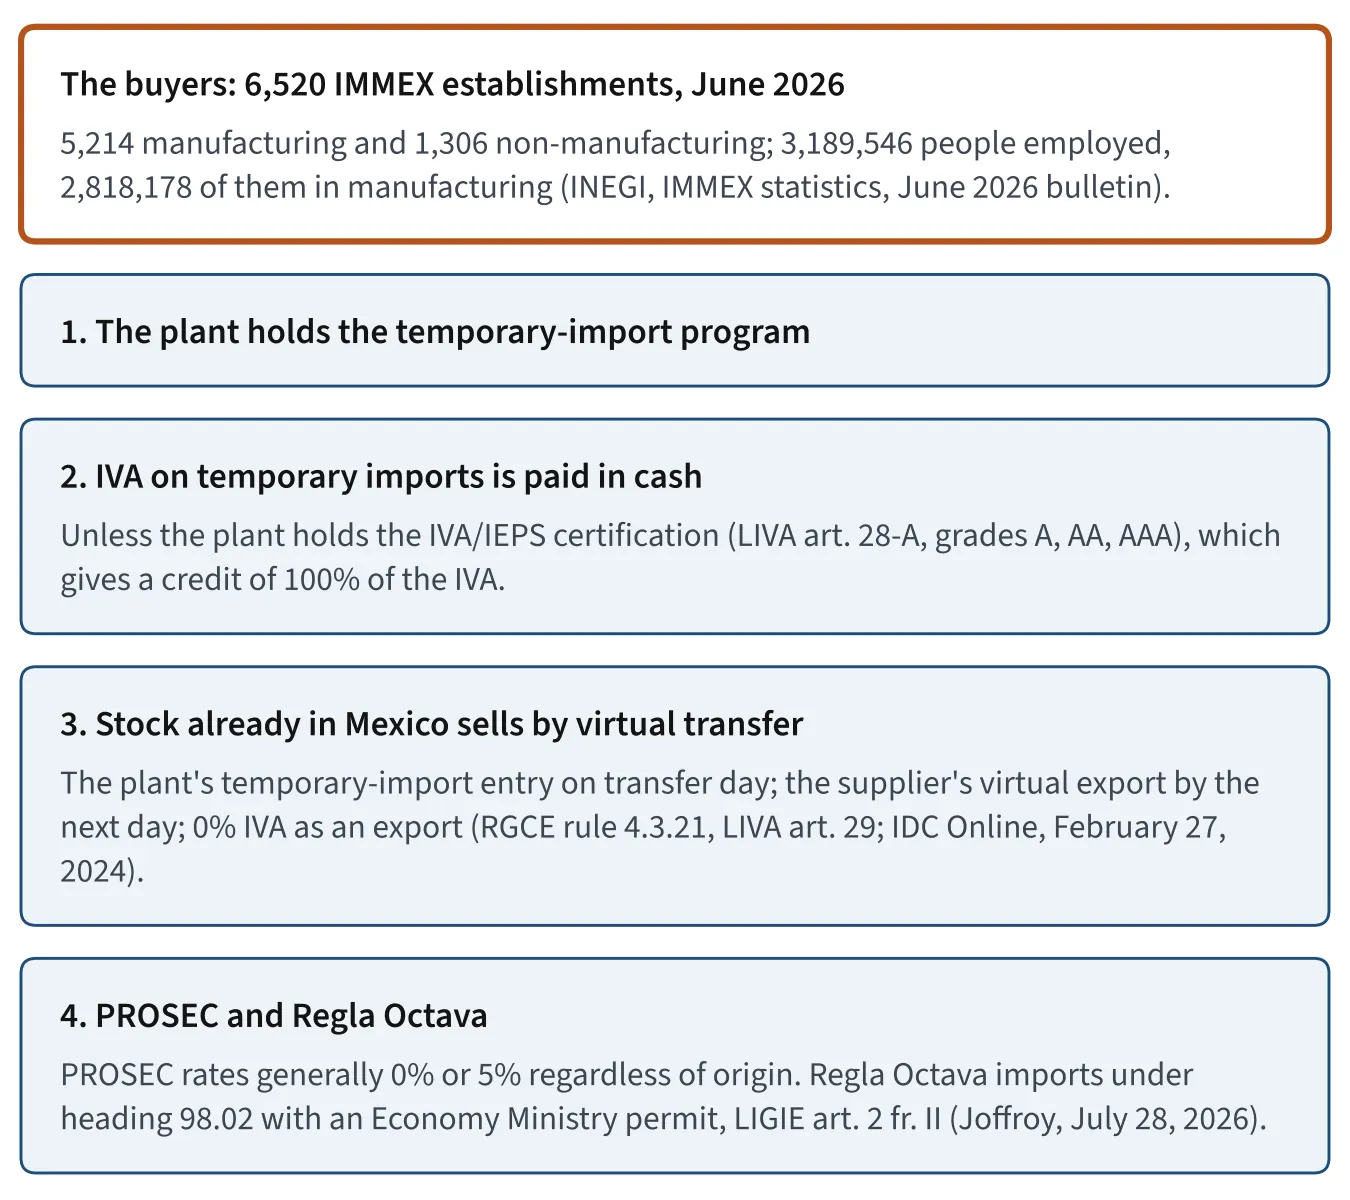
Five boxes: the 6,520 IMMEX plants as buyers, then the four facts that decide a sale to them.
Selling to an IMMEX plantFigure 10.2Source: INEGI, IMMEX statistics, bulletin for June 2026; IDC Online, February 27, 2024; Joffroy, July 28, 2026; Wikipedia, Maquiladora, read October 7, 2026.
Two bar charts: monthly pay ranges for three roles against Indeed averages; team's loaded annual cost against one US engineer.
What a team of three costs in Mexico, 2026Figure 10.3Source: Author's assessment, Bajío or Monterrey, October 2026; American Industries Group, April 7, 2026; Start-Ops Mexico labor cost index, May 2026, updated September 19, 2026; Indeed México, Monterrey, September 2026; US Bureau of Labor Statistics, May 2025.
Two bar charts: Mexico's packaging-machinery and machining-center imports by origin, United States highlighted.
Who sells Mexico its machinesFigure 11.1Source: DataMéxico, Secretaría de Economía, read October 7, 2026 (HS 8422, 2024); UN Comtrade via TrendEconomy (HS 8457, 2023).
Three bar charts: waterproofing-compound import shares by origin, plywood imports by origin, and plywood imports by state.
Two building materials, two positionsFigure 11.2Source: UN Comtrade via TrendEconomy (HS 3214, 2023); DataMéxico (HS 4412, 2024).
Two bar charts: Mexico's luminaire exports against imports in 2023, and import shares by origin.
Mexico makes more light than it buysFigure 11.3Source: UN Comtrade via TrendEconomy (HS 9405 and HS 8536, 2023).
Share bar: 99% of Mexico's tree-nut imports come from the US; bar chart of the main product values.
Almost every nut is AmericanFigure 11.5Source: UN Comtrade via TrendEconomy (HS 0802 and HS 2008.19, 2023); USDA FAS, July 7, 2026 (US exports, 2025).
Bar chart: Mexico's 2024 dental-instrument imports by origin, United States first, ahead of China and Switzerland.
Who supplies Mexico's dental instrumentsFigure 11.6Source: DataMéxico, Secretaría de Economía, read October 7, 2026 (HS 9018.49).
Bar chart: owned tractors per 100 farm units in Sonora, Sinaloa, Jalisco, Mexico nationally and Yucatán, 2022.
Two farm economiesFigure 11.7Source: INEGI Censo Agropecuario 2022, state results of November 21, 2023 and national results of April 5, 2024; USDA NASS 2022 Census of Agriculture.
Bar chart: milk per cow per day, about 37 liters in northern intensive herds against 9 to 10 in the southern ones.
The gap genetics sells intoFigure 11.8Source: The Bullvine, July 5, 2025; SIAP via BM Editores, April 27, 2026 (regional shares, 2023); DataMéxico (semen imports, 2024); NAAB, March 17, 2026 (2025 ranking); Renewable Fuels Association (distillers grains, 2024 to 2025)
Bar chart: US exporting companies in 2024, all, fewer than 500 employees, exporting to Canada and to Mexico.
The small exporter is the typical exporterFigure 11.9Source: US Census Bureau, A Profile of U.S. Importing and Exporting Companies, 2023-2024, released May 5, 2026
Bar chart: share of Mexico's 2024 goods imports by partner, United States 43.9% and China 19.6% far ahead.
Where Mexico's imports come fromFigure 12.1Source: Wikipedia, "Economy of Mexico", read October 7, 2026, from official trade data
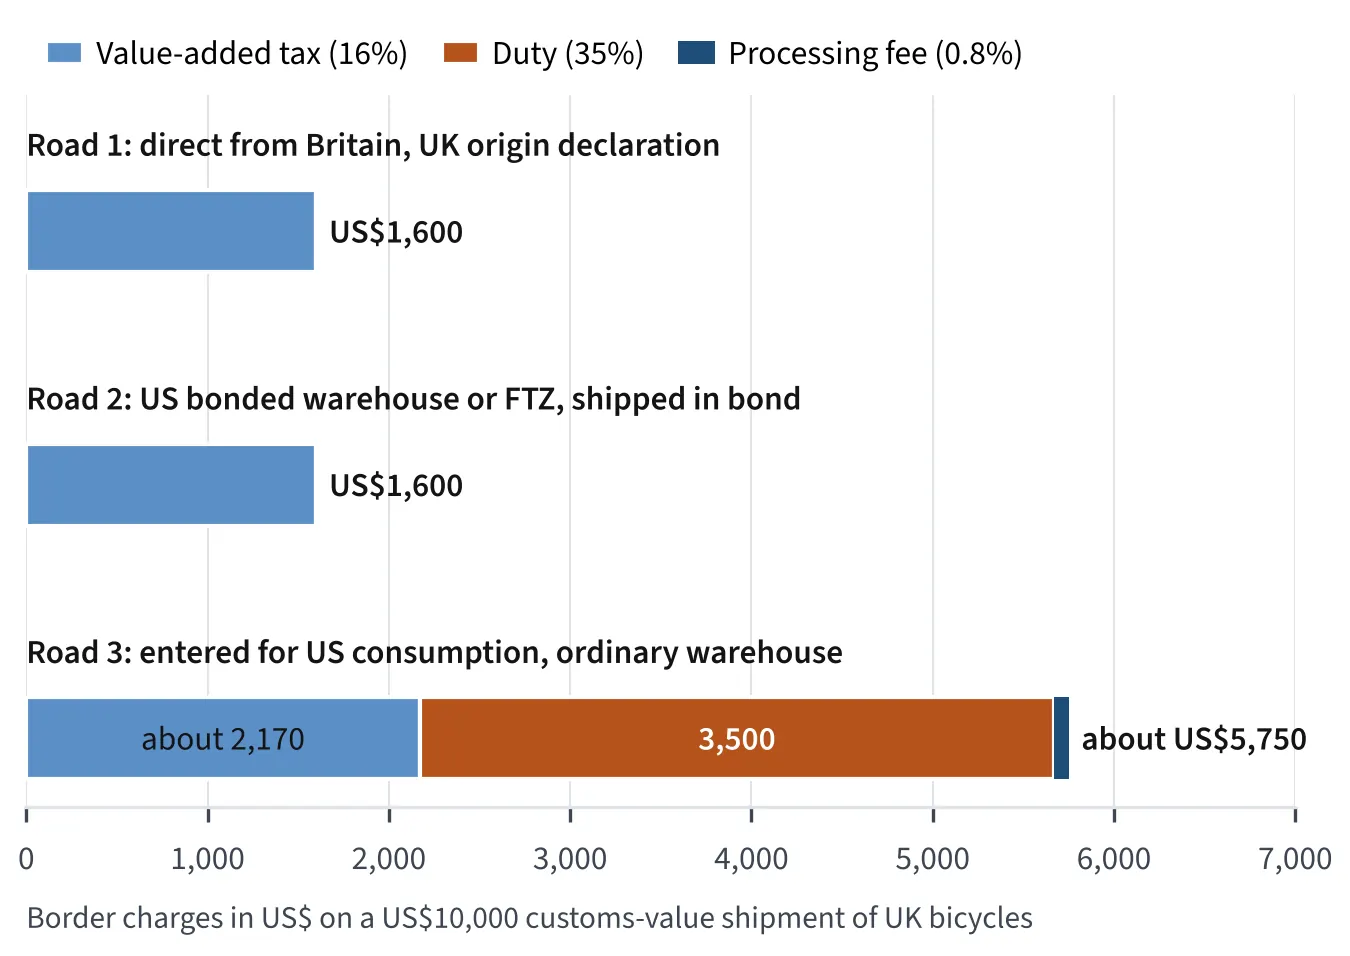
Stacked bar chart: border charges on US$10,000 of UK bicycles by three routes, US$1,600 twice against about US$5,750.
One British bicycle, three roads to MexicoFigure 12.2Source: DOF decree of April 23, 2026 (8712.00.05 at 35% from April 24, 2026); Mexico-UK Trade Continuity Agreement, in force January 1, 2021; Resolución en materia aduanera de la Decisión 2/2000, DOF December 31, 2002, Regla 1.3; 19 CFR 144.5 and 144.37
Two bar charts: installed distributed solar, 4,448 MW in 2024 and 5,437 MW in 2025; leading states Jalisco, Nuevo León, Chihuahua.
Rooftop solar in Mexico, 2024 to 2025Figure 12.3Source: CNE via Expansión and pv magazine, June 3, 2026; Diario de Yucatán, September 26, 2025 (outage)
Two bar charts: Mexico's toy imports by origin, 2024, and games and cards import shares, 2023; China leads both.
Toys, figures and cards: where Mexico buys themFigure 12.5Source: DataMéxico, Secretaría de Economía, read October 7, 2026; UN Comtrade via TrendEconomy
Bar chart: Mexico's skincare imports by origin, US$ million; the United States leads, China and South Korea are marked.
Same cream, different treatyFigure 12.6Source: DOF decree of December 29, 2025 (3304.99.01 and 3304.99.99 at 25%); DataMéxico, read October 7, 2026; UN Comtrade via TrendEconomy.
Bar chart: Mexico's knitted T-shirt exports and imports, 2024, US$ billion; exports exceed imports.
Mexico sells T-shirts northFigure 13.1Source: DataMéxico, Secretaría de Economía, read October 7, 2026; Alvarez & Marsal via Mondaq, February 3, 2026; DOF, December 29, 2025.
Bar chart: Mexico's dog and cat food imports by origin, 2024, US$ million; the United States far ahead.
Who may send pet treats to MexicoFigure 13.2Source: SENASICA traveler guidance, gob.mx, February 6, 2020; Agriculture and Agri-Food Canada, June 2022; DataMéxico, read October 7, 2026.
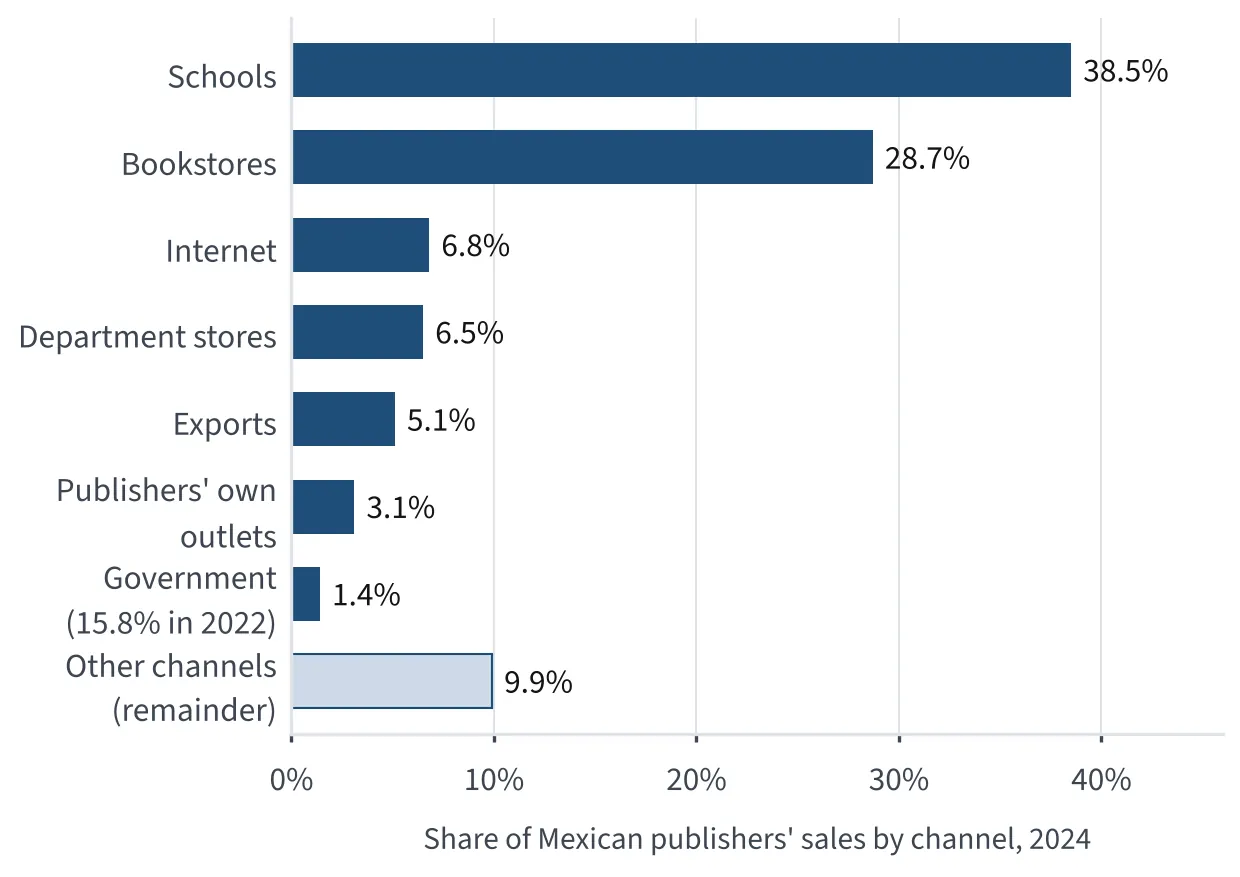
Bar chart: share of Mexican publishers' book sales by channel, 2024; schools and bookstores lead.
Where Mexico's books sellFigure 14.2Source: CANIEM, press booklet, December 2025, data year 2024.
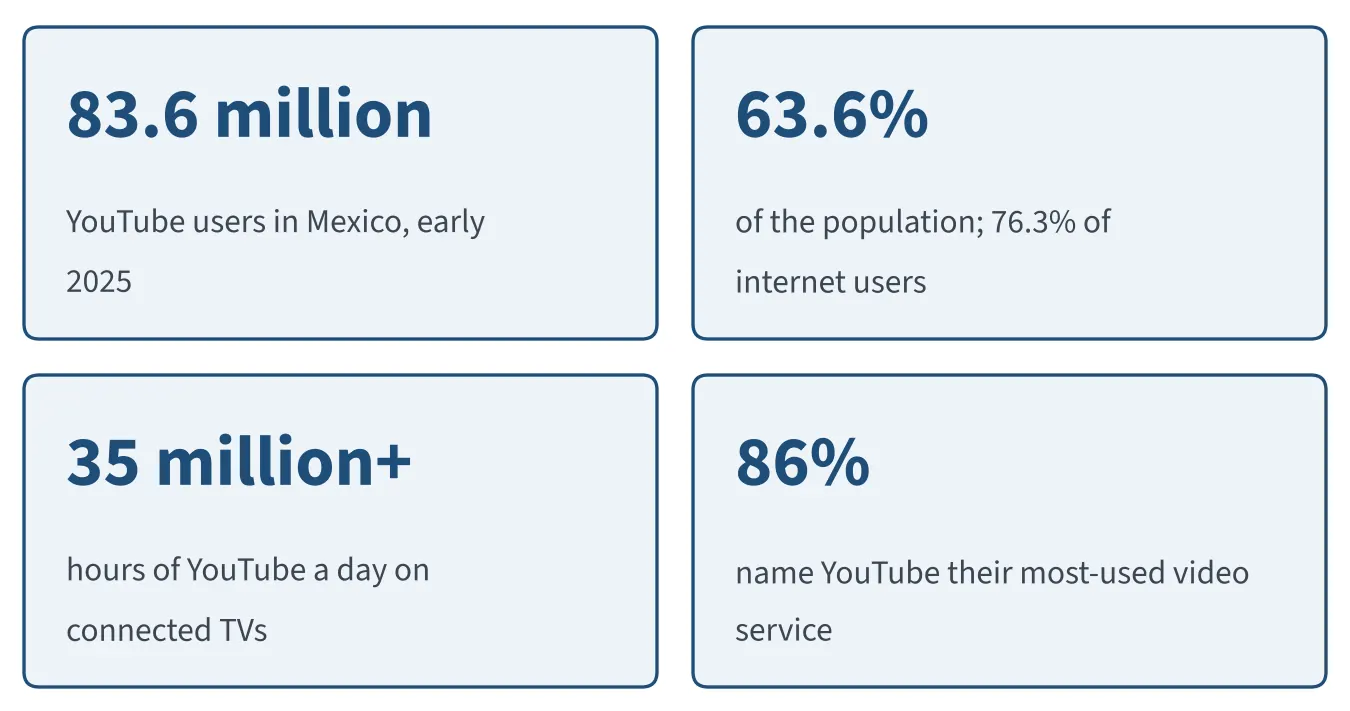
Four stat tiles: YouTube users in Mexico, share of population, daily hours on connected TVs, share naming it most used.
YouTube in Mexico and the dubbing pilotFigure 14.4Source: Xataka México, October 21, 2025, citing DataReportal, eMarketer and Nielsen; TechCrunch, September 10, 2025.
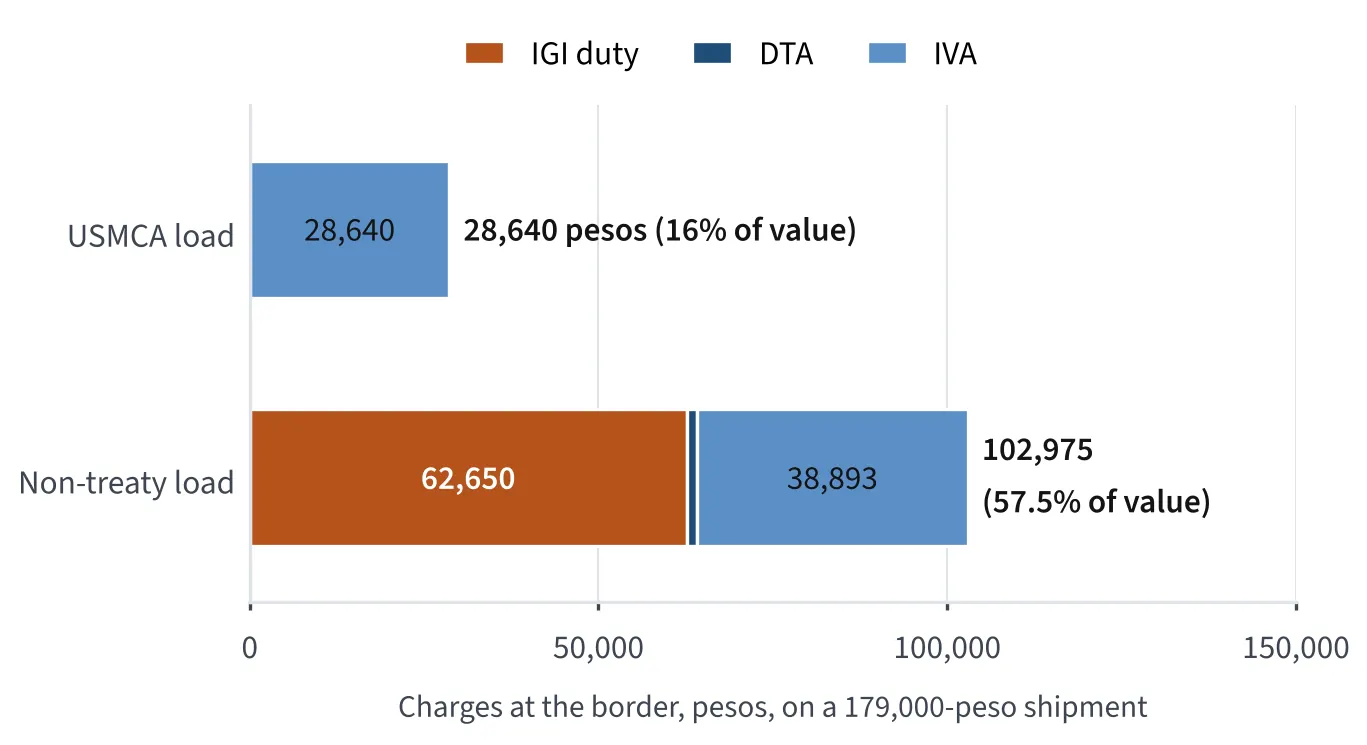
Stacked bar chart: border charges in pesos, USMCA load 28,640 against non-treaty load 102,975, by IGI, DTA and IVA.
The tax stack at the Mexican borderFigure 15.1Source: Ley Aduanera and LIGIE as reformed, DOF, December 29, 2025; Ley del IEPS 2026 quotas; Ley del IVA art. 1; author's calculation, October 2026.
Bar chart: landed cost of one container in US$ by item; factory price is about half.
One container, landedFigure 15.2Source: Figures stated by a Sonora e-commerce brand owner in a video of May 31, 2026; comparison from a Mexican customs firm, 2026.
Flow of five boxes: landed cost 100, importer margin, retailer or marketplace share, IVA, shelf price about 3 to 1.
From landed cost to shelf priceFigure 15.3Source: Author's range from his years in the market; Expansión, August 31, 2026 (marketplace commissions); LFPC arts. 7 Bis and 34.
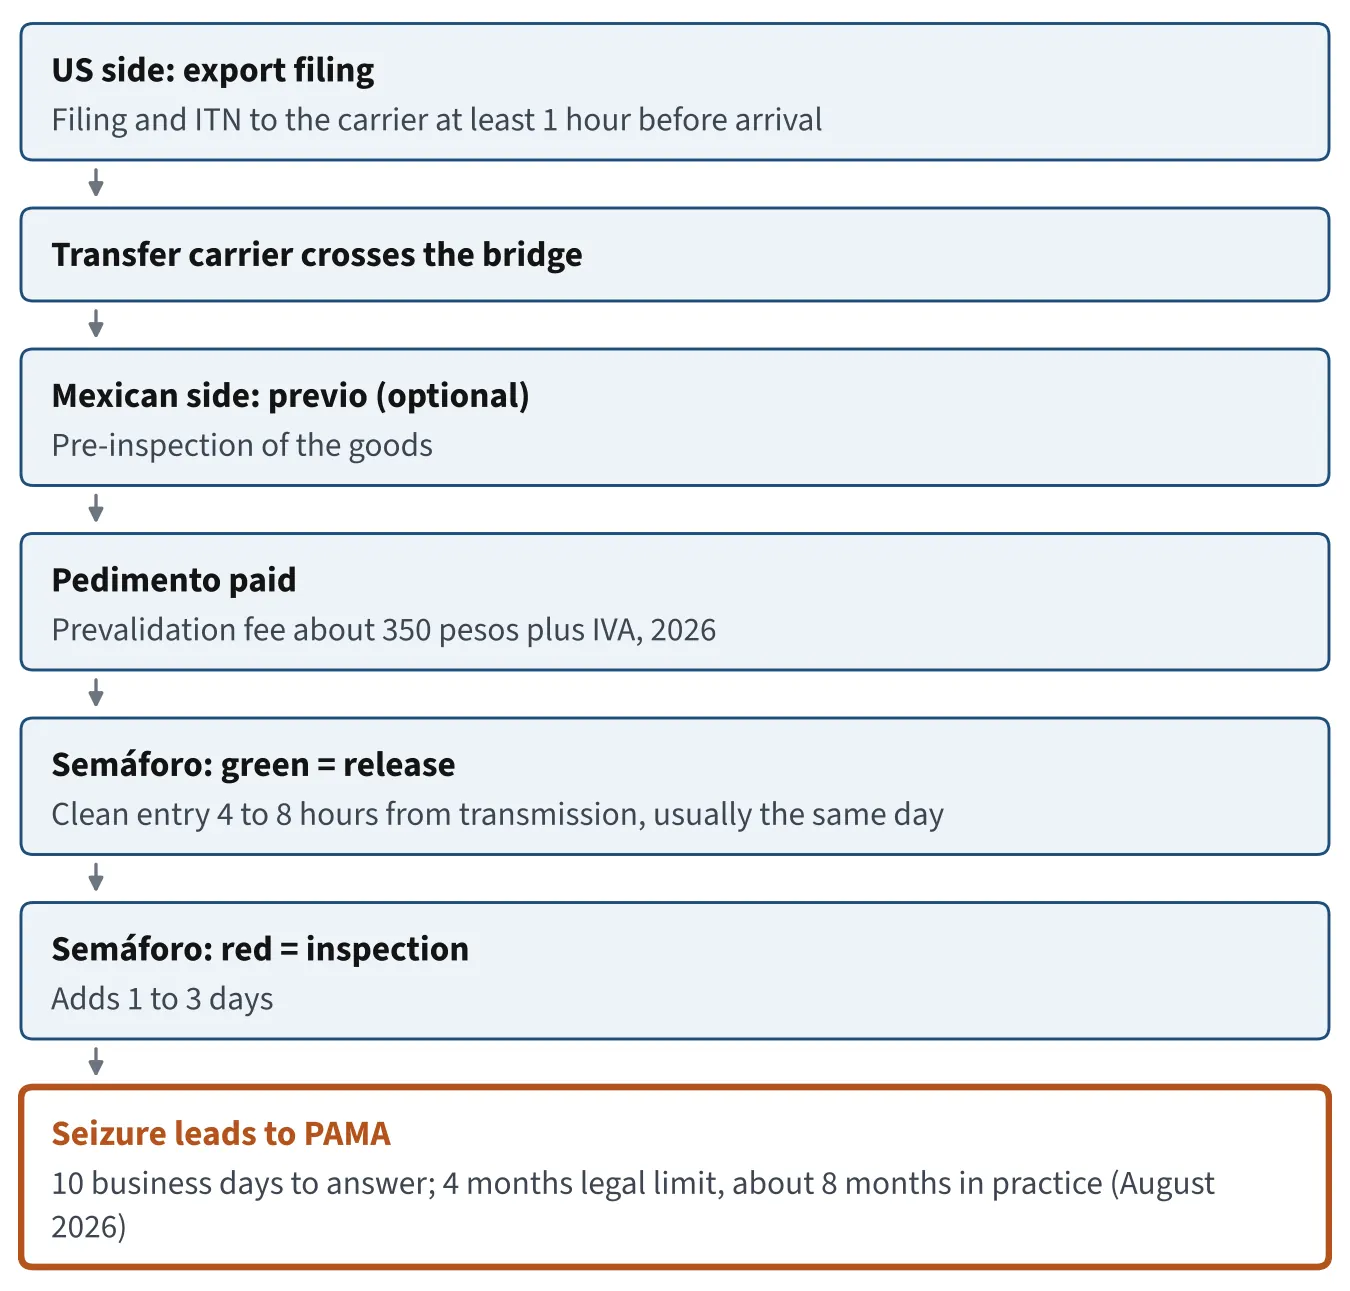
Flow of seven steps in a southbound truck crossing at Laredo, from US export filing to seizure and PAMA.
A truck's crossing at Laredo, step by stepFigure 15.6Source: Ley Aduanera; customs-software and freight firms, 2026; customs brokers' association member, August 2026; World Bank Enterprise Survey 2023; US trade statistics, 2025.
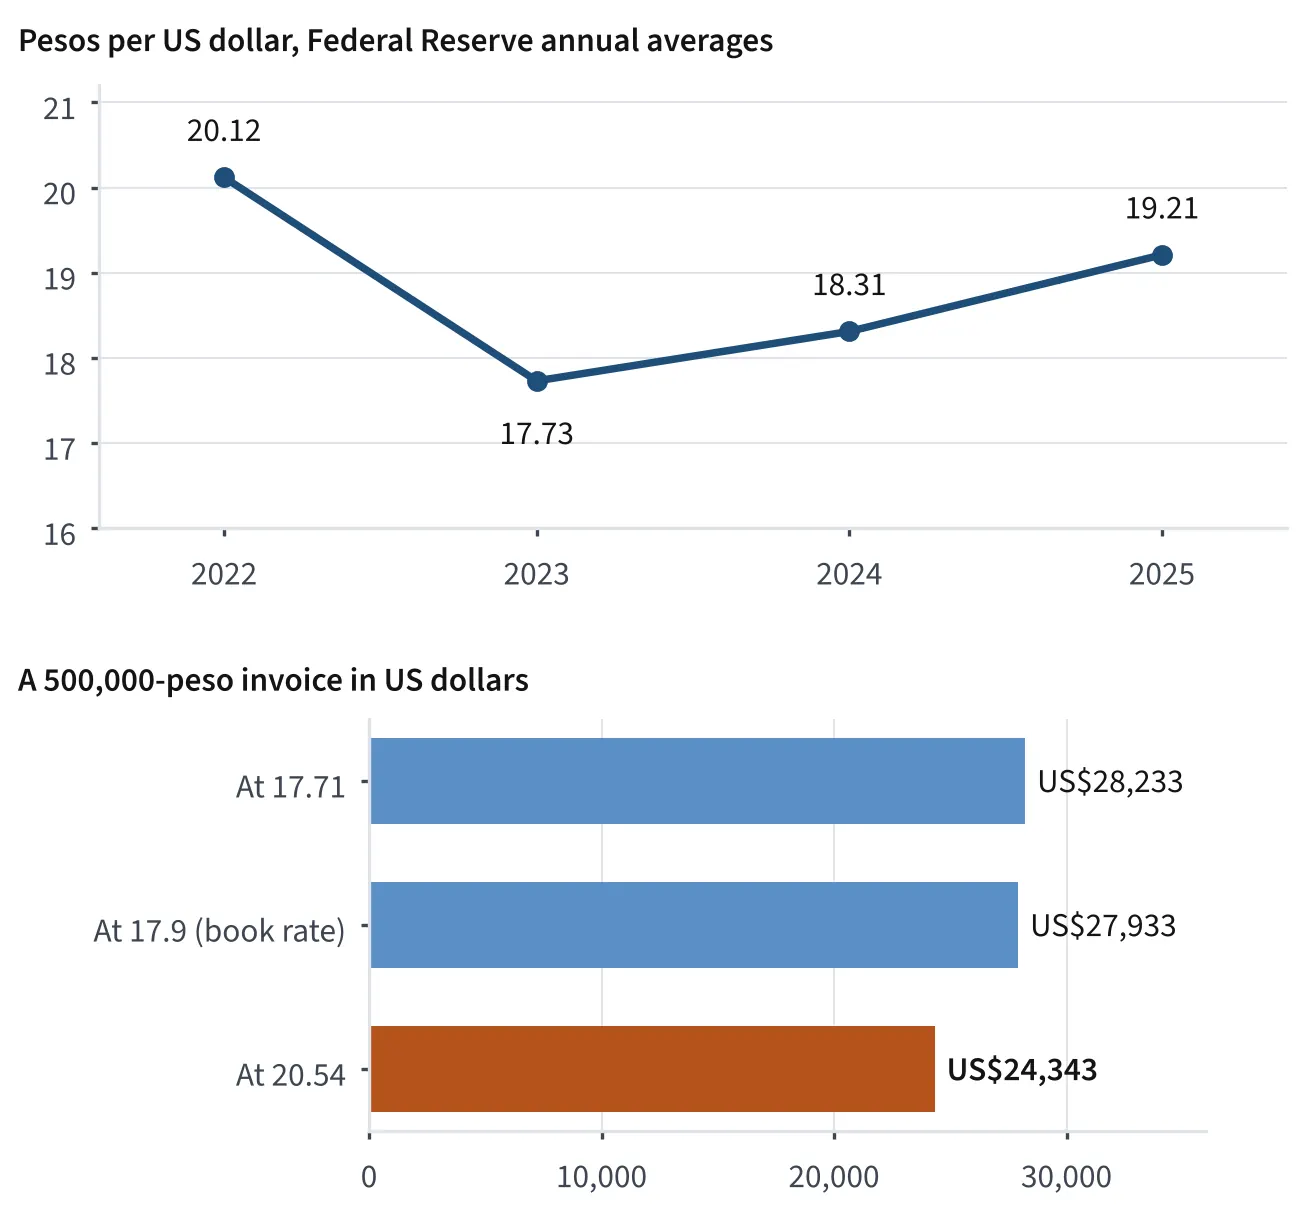
Line chart of pesos per dollar, 2022-2025, and bar chart of a 500,000-peso invoice in dollars at three rates.
The peso against the dollarFigure 15.9Source: Federal Reserve; Banco de México; DOF December 29, 2025 (book rate); El Congresista, October 2, 2026.
Flow of the eight steps to form a Mexican company, from name authorization to the foreign-investment registry.
Forming a Mexican companyFigure 15.10Source: Praxium Consultores, 2026; RemoFirst, December 17, 2025; a Mexico City law firm, 2026; World Bank Doing Business 2020.
Stacked bar: employer load over gross pay on a 12,000-peso Mexico City wage, four parts, about 35% in all.
What Mexican law gives every formal employeeFigure 15.11Source: Ley Federal del Trabajo as reformed DOF May 1, 2026; Ley del Seguro Social art. 15; Praxium Consultores, September 10, 2026; hacecuentas.com, August 2026.
Flow of six steps from factory to payment, showing who carries goods, liability and money; the bridge step is marked.
Who holds the bag, from factory to bankFigure 15.12Source: LFPC arts. 56, 77, 92 Ter; Ley Monetaria art. 8; LGTOC art. 165; Código de Comercio arts. 1461-1462; Customs Law reform widening joint liability, in force January 1, 2026.

Making It in Mexico

18 figures. See the book
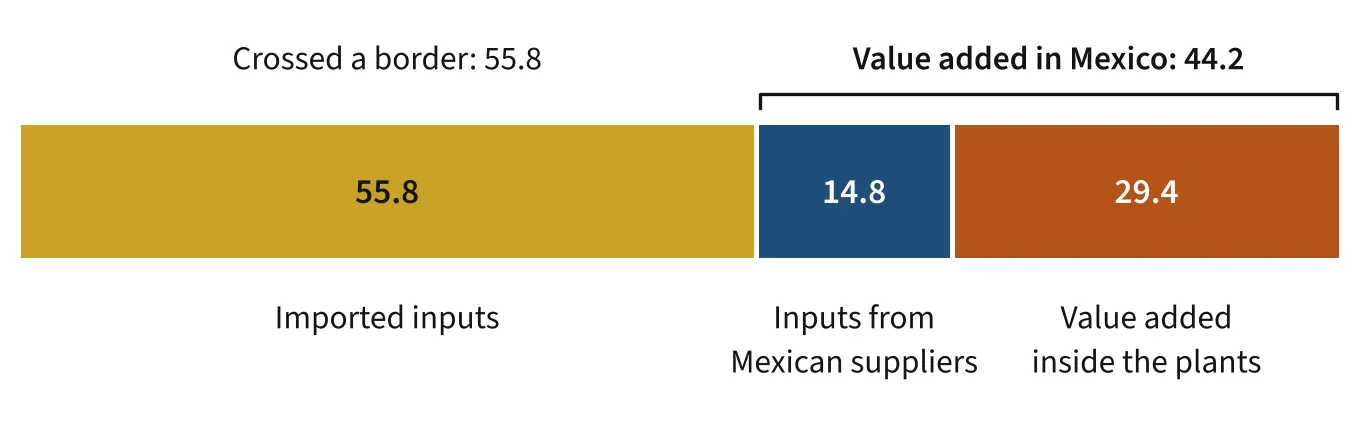
A single bar of 100 pesos: 55.8 for imported inputs, 14.8 for Mexican inputs, 29.4 value added in Mexico.
Where the hundred pesos go: imported inputs, Mexican inputs and value added in export manufacturing, 2024.Figure 1.1Source: INEGI, Valor Agregado de Exportación de la Manufactura Global 2024, published December 5, 2025 (Part Seven, Figure VII.7).
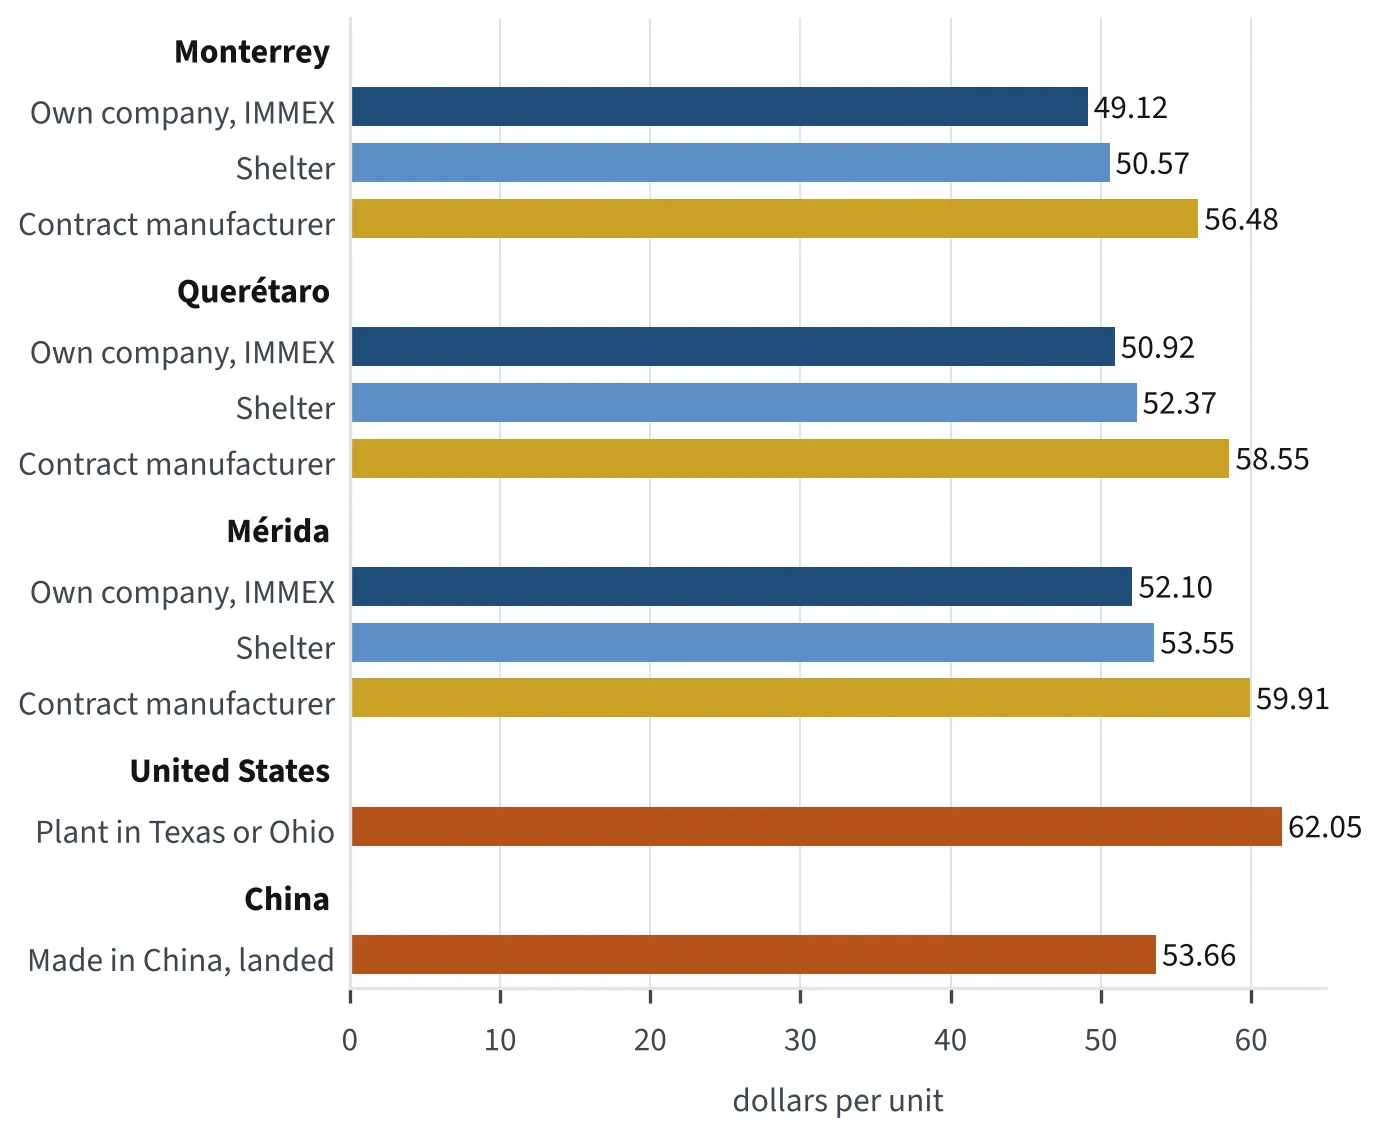
Bars: China 53.66 dollars, Monterrey 49.12, Mérida 52.10, Texas 62.05; labor 2.84, 4.55, 3.47 and 15.71.
One appliance delivered to Dallas, 2026: Mexico, Texas and China.Figure 1.2Source: Connected Continents Press cost model v1.2, October 15, 2026; duties: CBP CSMS #69326983, July 23, 2026; HTS 2026.
Mexico rose from 13.4 percent of U.S. goods imports in 2017 to 15.8 percent in 2024; China fell from 21.6 percent to 13.2 percent in 2024 and about 9.0 percent in 2025.
Where the United States buys its goods: Mexico and China, share of goods imports, 2017 to 2025.Figure 2.1Sources: 2017, IBA, May 2025; 2024, Federal Reserve Bank of Dallas economists, December 5, 2024; China 2025, derived from Census Bureau data; May 2026, Census data as relayed.
Monterrey: wage 15,753 pesos, total 25,328 (1,398 dollars). Querétaro: wage 15,618, total 25,117 (1,387 dollars). Mérida: wage 11,962, total 19,360 (1,069 dollars).
The full cost of an operator, per month, 2026: wage and each legal charge, Monterrey, Querétaro and Mérida.Figure 3.1Source: Connected Continents Press, Book 3 cost model, generated October 12, 2026, state wages updated to July 2026 on October 13, 2026, rerun October 15, 2026; dollars at the Banco de México FIX of 18.1128 pesos (October 8, 2026); product illustrative.
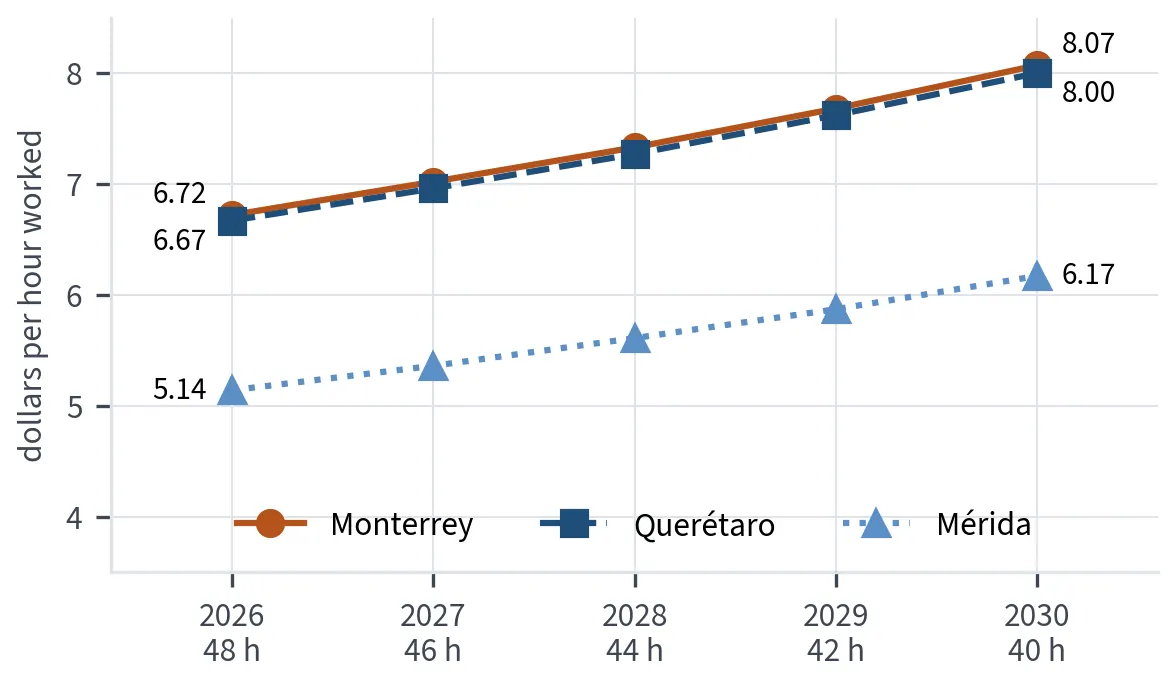
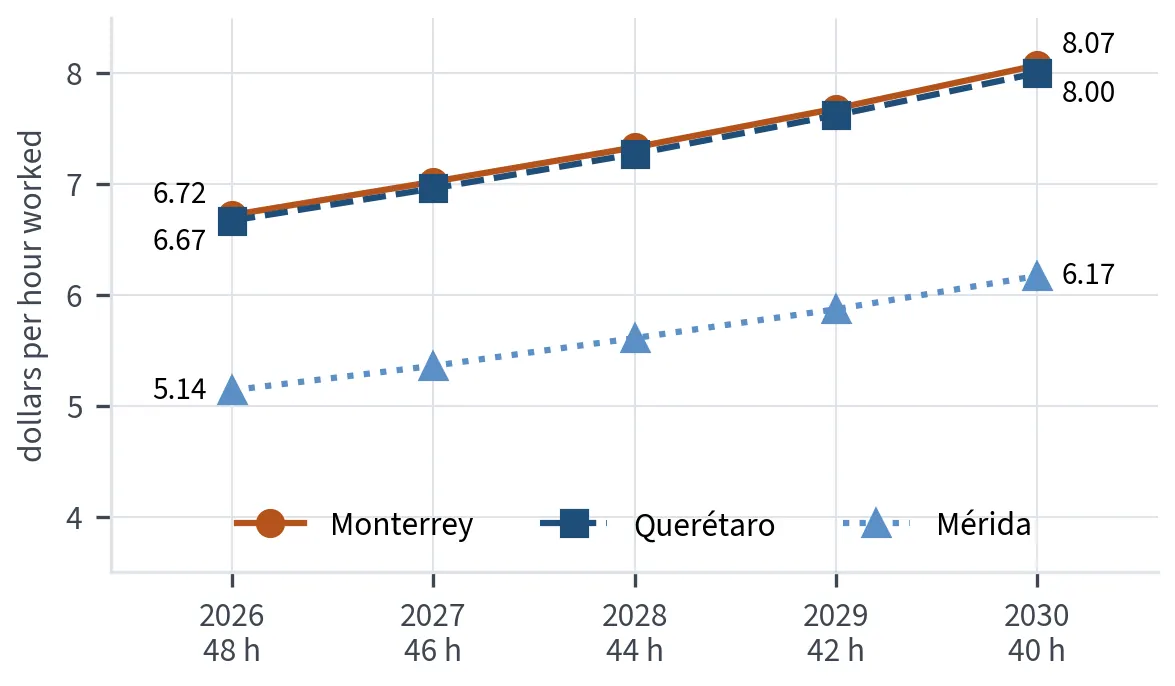
Monterrey 6.72 to 8.07 dollars an hour, Querétaro 6.67 to 8.00, Mérida 5.14 to 6.17, 2026 to 2030.
The 40-hour week: operator cost per hour worked, 2026 to 2030.Figure 3.2Source: Connected Continents Press, Book 3 cost model, generated October 12, 2026, state wages updated to July 2026 on October 13, 2026, rerun October 15, 2026; dollars at the Banco de México FIX of 18.1128 pesos (October 8, 2026); product illustrative.
Stacked bars: Monterrey 49.12, Querétaro 50.92, Mérida 52.10, Texas 62.05, China 53.66 dollars a unit, split into parts, import duties, labor, freight and plant.
One appliance delivered to Dallas, 2026: each cost line, Monterrey, Querétaro, Mérida, Texas and China.Figure 3.3Source: Connected Continents Press, Book 3 cost model, generated October 12, 2026, state wages updated to July 2026 on October 13, 2026, rerun October 15, 2026; dollars at the Banco de México FIX of 18.1128 pesos (October 8, 2026); product illustrative.
100 people: built to suit 2.23 million dollars, first output month 11; leased shell 3.34 million, month 3; used machines 2.56 million, month 2. 300 people: 5.61, 8.95 and 6.89 million.
The first year, three ways: cumulative cash and first shipment, Mérida, 100 and 300 people, 2026.Figure 3.4Source: Connected Continents Press, Book 3 cost model, generated October 12, 2026, state wages updated to July 2026 on October 13, 2026, rerun October 15, 2026; dollars at the Banco de México FIX of 18.1128 pesos (October 8, 2026); product illustrative.
Base gap 1.56 dollars in Mexico's favor. Without the forced-labor duty: 5.94 in China's favor. Fan not qualifying under the USMCA: 7.26 in China's favor. Section 301 at 25 percent on the fan: 12.06 in Mexico's favor. PROSEC: 3.66 in Mexico's favor. Labor halved: 2.59; labor up half: 0.53. Forty-hour
What moves the answer: Mérida against China, dollars a unit, 2026.Figure 3.5Source: Connected Continents Press cost model v1.2, October 15, 2026, Table 6.
At 550 dollars a head, 1.98 million dollars in year one rising to 7.92 million by year four; at 350 dollars, 1.26 million to 5.04 million; an own back office, 0.24 million to 0.95 million.
The shelter clock: cumulative shelter fees against your own back office, 300 people, by year.Figure 8.1Source: Connected Continents Press, Book 3 cost model, generated October 12, 2026, state wages updated to July 2026 on October 13, 2026, rerun October 15, 2026; dollars at the Banco de México FIX of 18.1128 pesos (October 8, 2026); product illustrative.
Monterrey: own company 49.12, toller 49.48, shelter 50.57, contract manufacturer 56.48. Querétaro: 50.92, 51.26, 52.37, 58.55. Mérida: 52.10, 52.34, 53.55, 59.91.
One appliance delivered to Dallas, 2026, by route: own company, toller, shelter and contract manufacturer.Figure 9.1Source: Connected Continents Press, Book 3 cost model, generated October 12, 2026, state wages updated to July 2026 on October 13, 2026, rerun October 15, 2026; dollars at the Banco de México FIX of 18.1128 pesos (October 8, 2026); product illustrative.
100 people: built to suit 2.23 million dollars, first output month 11; leased shell 3.34 million, month 3; used machines 2.56 million, month 2. 300 people: 5.61, 8.95 and 6.89 million.
The first year, three ways: cumulative cash and first shipment, Mérida, 100 and 300 people, 2026.Figure 10.1Source: Connected Continents Press, Book 3 cost model, generated October 12, 2026, state wages updated to July 2026 on October 13, 2026, rerun October 15, 2026; dollars at the Banco de México FIX of 18.1128 pesos (October 8, 2026); product illustrative.
100-person plant: 1.5 million new; 0.89 to 0.95 million after three years; 0.75 to 0.86 million after five. 300-person plant: 4.0 million new; 2.37 to 2.53 million after three; 2.01 to 2.28 million after five. Landed product: zero.
What the machines are worth after three and five years, against a landed product.Figure 10.2Source: Connected Continents Press, Book 3 cost model, generated October 12, 2026, state wages updated to July 2026 on October 13, 2026, rerun October 15, 2026; dollars at the Banco de México FIX of 18.1128 pesos (October 8, 2026); product illustrative.
With IMMEX 49.12 dollars a unit, without IMMEX 49.29; in both, 7.91 dollars is the Mexican duty on Chinese parts.
What IMMEX saves and what it does not, per appliance, Monterrey, 2026.Figure 11.1Source: Connected Continents Press, Book 3 cost model, generated October 12, 2026, state wages updated to July 2026 on October 13, 2026, rerun October 15, 2026; dollars at the Banco de México FIX of 18.1128 pesos (October 8, 2026); product illustrative.
Operator, technician, supervisor per hour: Monterrey 6.72, 9.53, 9.51; Querétaro 6.67, 9.45, 9.12; Mérida 5.14, 7.31, 7.00. Texas operator 22.25. China operator 4.55.
The full cost of a worker by market and role, 2026, against Texas and China.Figure 15.1Source: Connected Continents Press, Book 3 cost model, generated October 12, 2026, state wages updated to July 2026 on October 13, 2026, rerun October 15, 2026; dollars at the Banco de México FIX of 18.1128 pesos (October 8, 2026); product illustrative.
Monterrey 6.72 to 8.07 dollars an hour, Querétaro 6.67 to 8.00, Mérida 5.14 to 6.17, 2026 to 2030.
The same operator, the same pay, fewer hours: cost per hour worked, 2026 to 2030.Figure 15.2Source: Connected Continents Press, Book 3 cost model, generated October 12, 2026, state wages updated to July 2026 on October 13, 2026, rerun October 15, 2026; dollars at the Banco de México FIX of 18.1128 pesos (October 8, 2026); product illustrative.
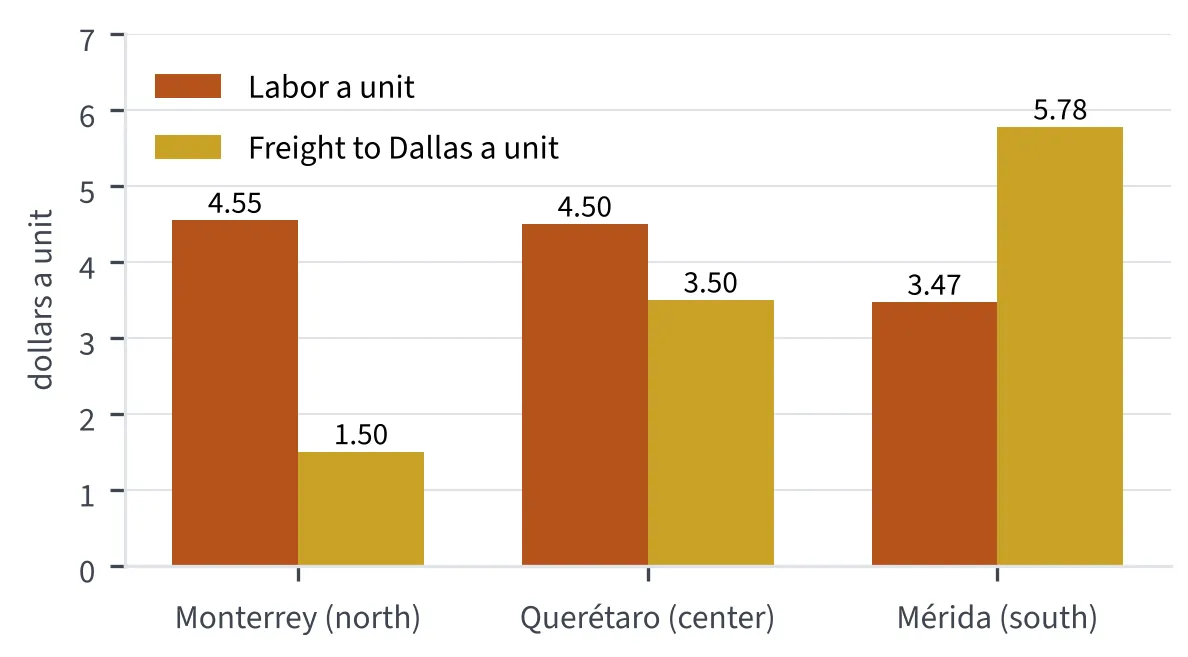
Labor a unit: Monterrey 4.55, Querétaro 4.50, Mérida 3.47 dollars. Freight to Dallas: 1.50, 3.50, 5.78 dollars.
North, center and south: labor saved and freight spent per unit, delivered to Dallas, 2026.Figure 16.1Source: Connected Continents Press, Book 3 cost model, generated October 12, 2026, state wages updated to July 2026 on October 13, 2026, rerun October 15, 2026; dollars at the Banco de México FIX of 18.1128 pesos (October 8, 2026); product illustrative.
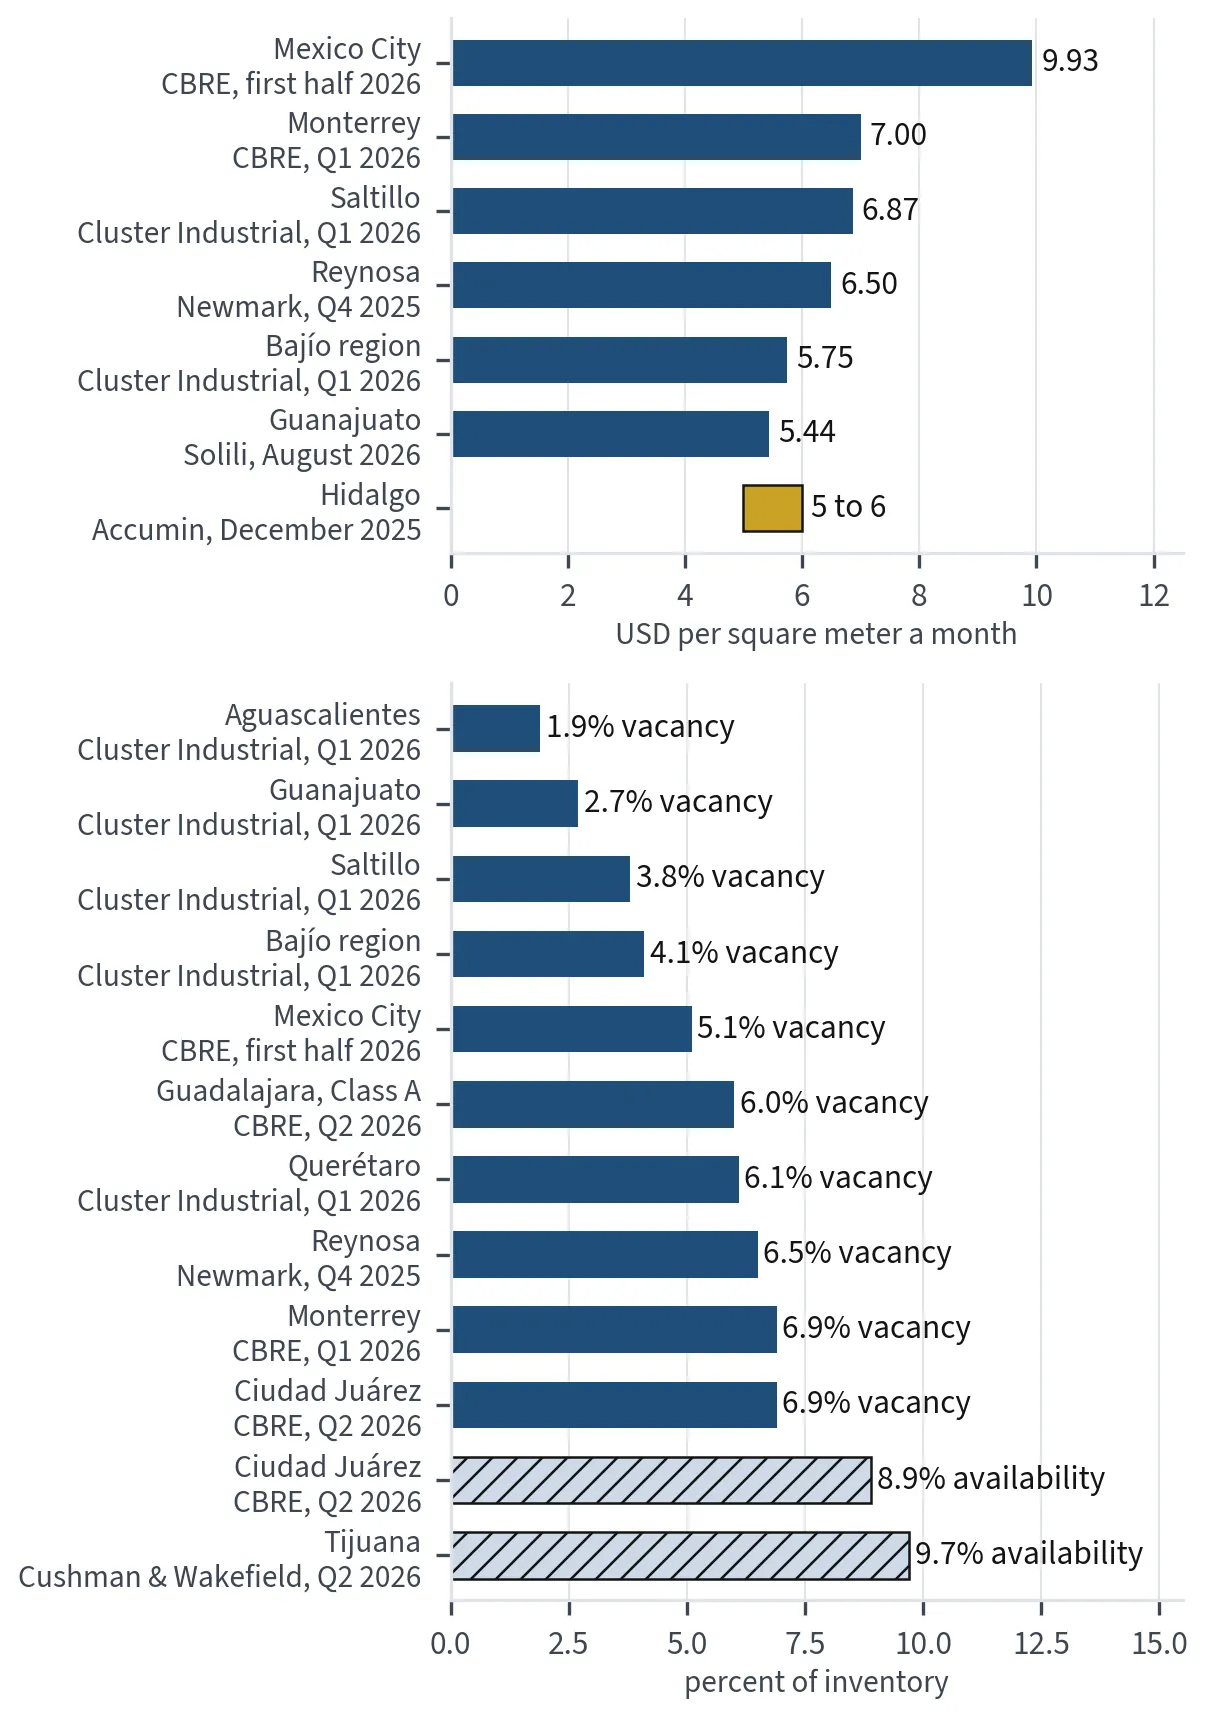
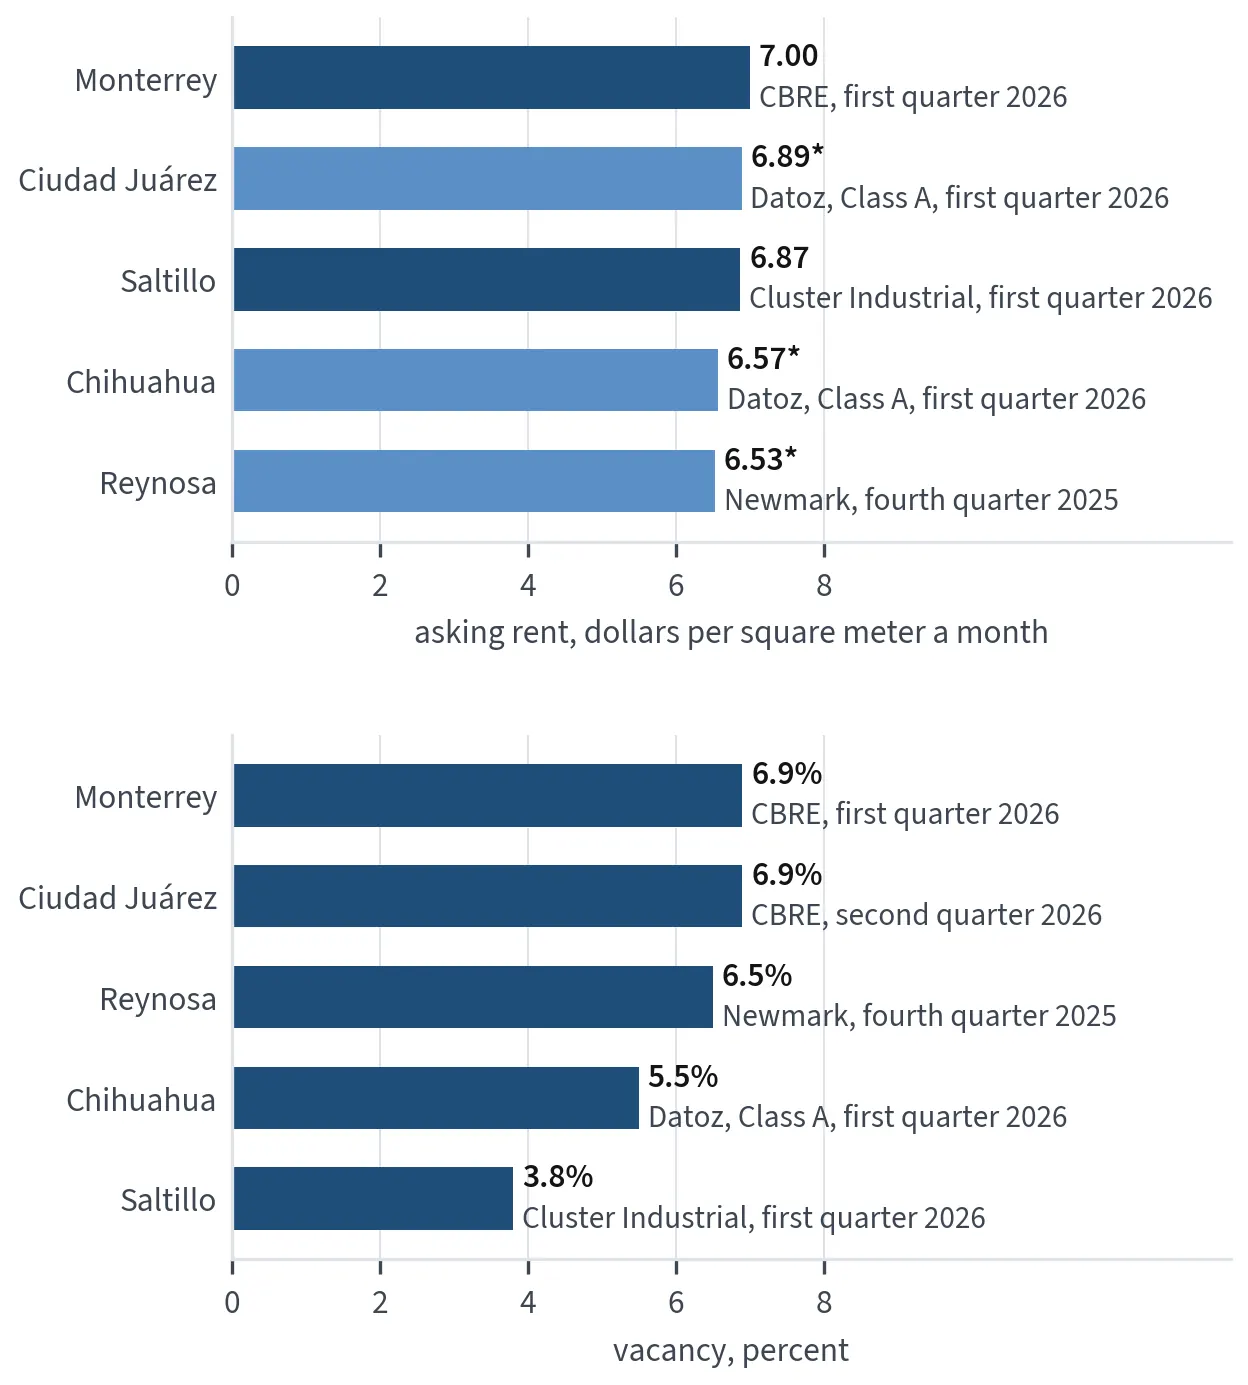
Rent per square meter a month: Bajío 5.75 dollars, vacancy 4.1 percent; Saltillo 6.87, 3.8 percent; Monterrey 7.00, 6.9 percent; Mexico national 7.63, 5.2 percent; United States 9.37.
Industrial rent and vacancy by market, 2026, against the United States.Figure 17.2Sources: Bajío, Monterrey and Saltillo, Cluster Industrial, April 15, 2026; national, Solili, July 2026; United States, JLL, second quarter of 2026 (as in Chapter 17).
Laredo 2,945,388 trucks; Otay Mesa 990,111; Hidalgo 719,184; Ysleta 641,729; Calexico East 446,835.
Truck crossings into the United States by port, 2025.Figure 18.2Source: U.S. Bureau of Transportation Statistics, February and May 2026 (as in Chapter 18).

Exporting from Mexico

31 figures. See the book

Grouped horizontal bar chart of American goods imports in billions of dollars. Mexico: 534.3 in 2025 and 419.3 in January to August 2026. Canada: 381.9 and 269.6. China: 308.7 and 183.5. Vietnam: 193.9 and 176.1. Mexico is the largest source in both periods, and in 2025 it sold the United States mor
American goods imports from Mexico, Canada, China and Vietnam, 2025 and January to August 2026.Figure 1.1Source: Office of the United States Trade Representative, country pages, 2026, and U.S. Census Bureau, as compiled October 2026; Chapter 1 of this book.
Range bar chart of quoted transit days. Truck from Guadalajara to Dallas, 4 to 6 days, and from Monterrey to Chicago, 5 to 7 days, each including 1 to 3 days at the border (Cargado, 2026). Ocean from Shanghai to Los Angeles: 13 to 17 days on the water (Flexport, September 2026), 14 to 20 days port t
Quoted transit times: truck lanes from Monterrey and Guadalajara against ocean routes from Shanghai, 2025 and 2026.Figure 1.2Source: Cargado lane pages, 2026; Flexport rate page, September 2026; Ship4wd, November 21 and 27, 2025, modified March 20, 2026; Chapter 1 of this book.
Horizontal bar chart of the composition of Mexico's merchandise exports in 2025: manufactures 91.6 percent, petroleum 3.2 percent, agriculture 3.1 percent and non-oil mining 2.1 percent.
What Mexico exports, by share of merchandise exports, 2025: manufactures, petroleum, agriculture and non-oil mining.Figure 2.1Source: Banco de México, February 9, 2026; INEGI, January 27, 2026; Chapter 2 of this book.
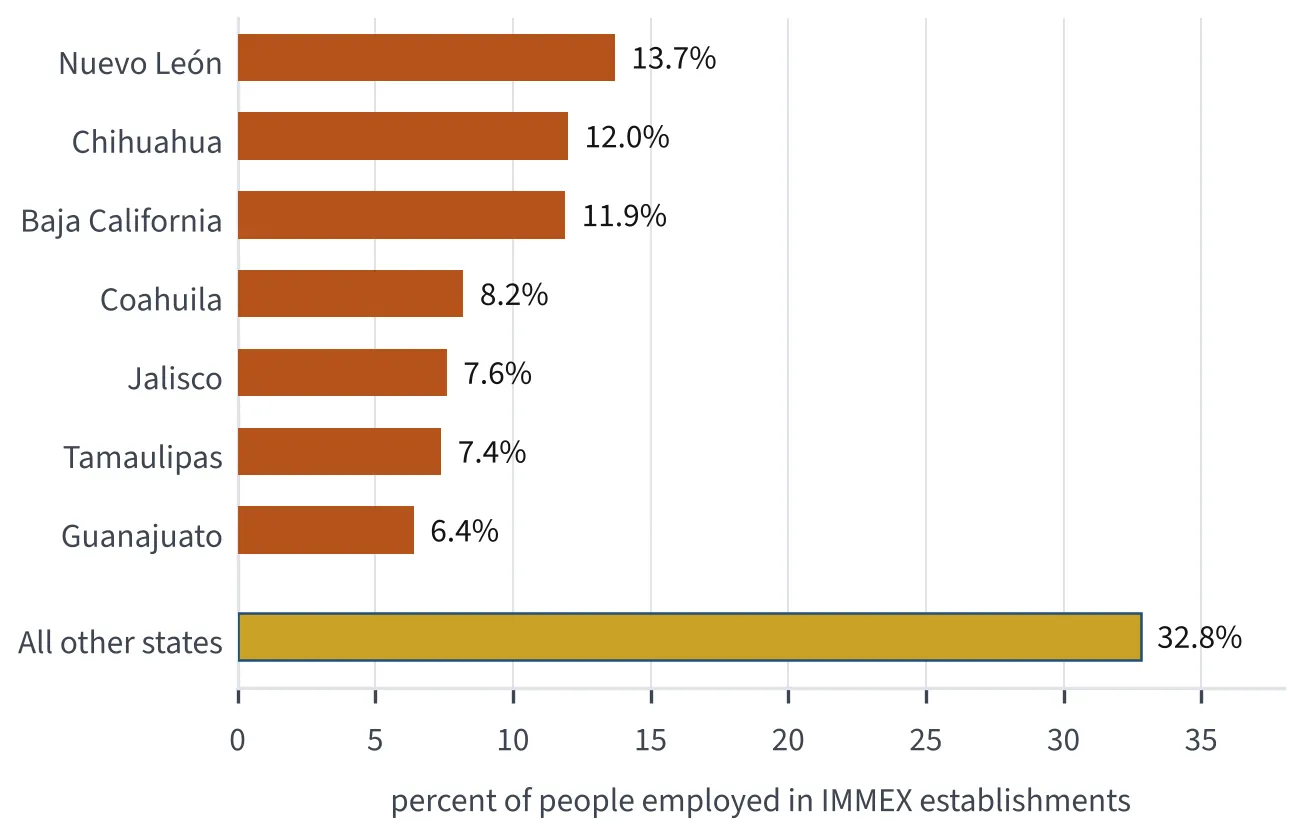
Horizontal bar chart of each state's share of people employed in IMMEX export establishments in July 2026: Nuevo León 13.7 percent, Chihuahua 12.0, Baja California 11.9, Coahuila 8.2, Jalisco 7.6, Tamaulipas 7.4 and Guanajuato 6.4, together 67.2 percent; all other states 32.8 percent.
Where the export workforce is: share of people employed in IMMEX establishments by state, July 2026.Figure 2.2Source: INEGI, IMMEX program statistics for July 2026, published September 23, 2026; Chapter 2 of this book.
A single bar of 100 pesos of production in Mexico's global-export manufacturing in 2024, divided into imported inputs, 55.8 pesos; inputs from Mexican suppliers, 14.8 pesos; and value added inside the plants, 29.4 pesos. The last two together, 44.2 pesos, are the value added in Mexico.
Where the hundred pesos go in export manufacturing, 2024: imported inputs, Mexican inputs and value added in Mexico.Figure 2.3Source: INEGI, Valor Agregado de Exportación de la Manufactura Global (VAEMG), 2024, published December 5, 2025; Chapter 2 of this book.
Two horizontal bars split into imports entered under the USMCA preference and imports entered without it. Before 2025, roughly 50 percent of American imports from Mexico entered under the preference and about 50 percent did not. By July 2025, about 80 percent of imports from Mexico and Canada qualif
Share of American imports entering under the USMCA preference, before 2025 and July 2025.Figure 3.1Source: Federal Reserve Bank of Dallas, August 4 and August 18, 2026; Chapter 3 of this book.
Horizontal bar chart of Mexico's footwear trade in 2024. Exports were 974 million dollars, of which 85 percent, about 828 million, went to the United States and about 146 million elsewhere. Imports were 2,161 million dollars, more than twice exports.
Mexico's footwear trade in 2024: exports of 974 million dollars against imports of 2,161 million.Figure 4.1Source: Xataka México, July 22, 2026; Chapter 4 of this book.
Horizontal bar chart. Private label was 17.2 percent of sales at Walmart de México in 2025, 13 percent at Soriana in 2025 and 8.6 percent at Chedraui in 2024. Beside them, American store brands held 21.2 percent of dollar sales in the first half of 2025.
Private-label share of sales at Walmart de México (2025), Soriana (2025) and Chedraui (2024), beside the American store-brand dollar share (first half of 2025).Figure 4.2Source: Walmart de México, Soriana and Chedraui annual reports as cited by Expansión, January 9 and August 28, 2026; Chain Drug Review, July 22, 2025; Chapter 4 of this book.
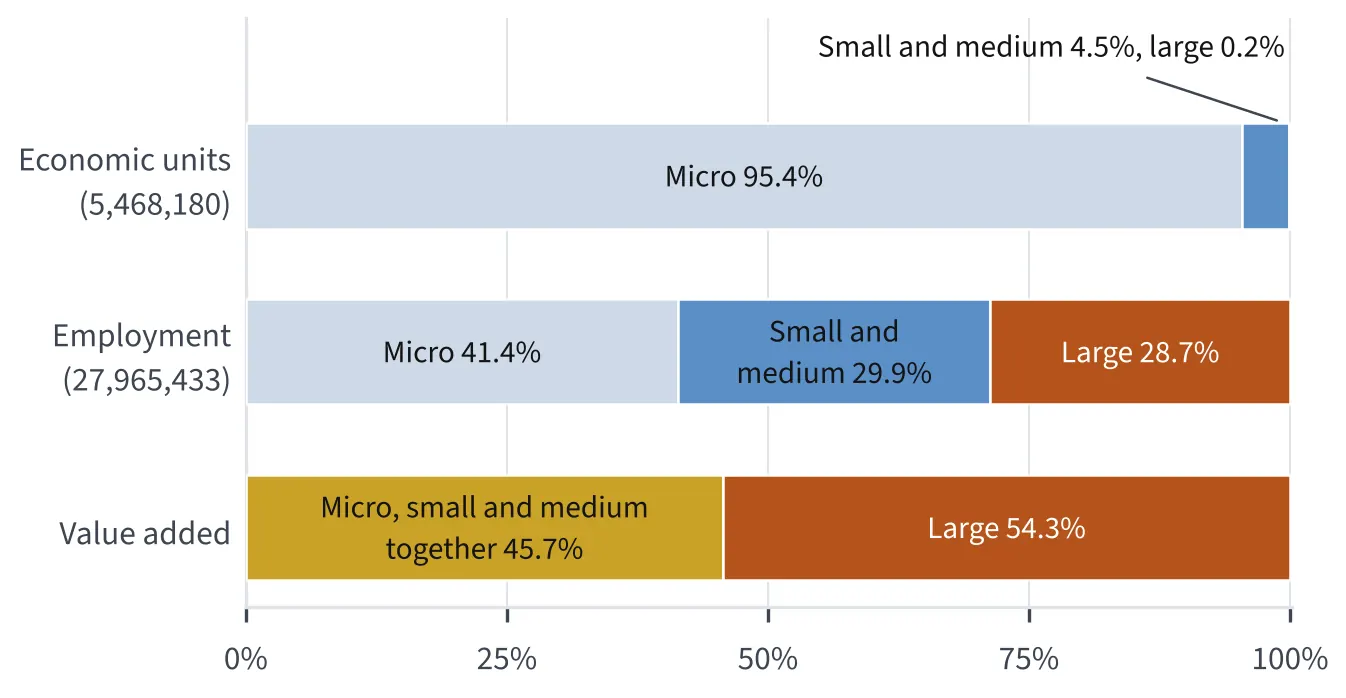
Three stacked bars of shares by firm size in 2023. Economic units: micro 95.4 percent, small and medium 4.5 percent, large 0.2 percent. Employment: micro 41.4 percent, small and medium 29.9 percent, large 28.7 percent. Gross census value added: firms below 250 workers together 45.7 percent, large fi
Mexico's economic units, employment and value added by firm size, 2023.Figure 5.1Source: INEGI, Censos Económicos 2024, definitive results, July 2025 (figures for 2023); Chapter 5 of this book.
Two panels. Left: artisan activity generated 153,437 million pesos in 2021, 0.6 percent of GDP, and households spent 154,810 million pesos on crafts that year. Right: the activity provided 479,655 paid jobs.
Artisan crafts in Mexico's economy, 2021: output, paid jobs and household spending.Figure 5.3Source: INEGI, March 16, 2023; Chapter 5 of this book.
Horizontal bar chart of the share of Mexican firms using each source of financing in the second quarter of 2026: supplier financing 60.9 percent, commercial bank credit 24.5 percent, new bank credit 11.2 percent.
How Mexican firms financed themselves, second quarter of 2026: supplier financing, bank credit and new bank creditFigure 10.1Source: Banco de México, quarterly survey of credit market conditions, second quarter of 2026; Chapter 10 of this book.
Dot chart of pesos per dollar: 19.2052 as the Federal Reserve's 2025 average, 18.0012 at Banco de México's fix on December 31, 2025, 17.7100 on September 25, 2026, the strongest of the four, and 18.2542 on October 12, 2026.
Pesos per dollar: 2025 average, December 31, 2025, September 25, 2026 and October 12, 2026Figure 10.3Source: Federal Reserve, G.5A, 2025 annual average, published January 5, 2026; Banco de México, FIX, December 31, 2025, September 25, 2026 and October 12, 2026; Chapter 10 of this book.
Horizontal bar chart in two groups. Clearing direct exports: Mexico 20.5 days, Latin America and the Caribbean 8.6 days. Clearing imports: Mexico 16.6 days, Latin America and the Caribbean 20.5 days.
Days to clear direct exports and imports, Mexico against Latin America and the Caribbean, 2023.Figure 11.3Source: World Bank, Enterprise Survey, Mexico, 2023; Chapter 11 of this book.
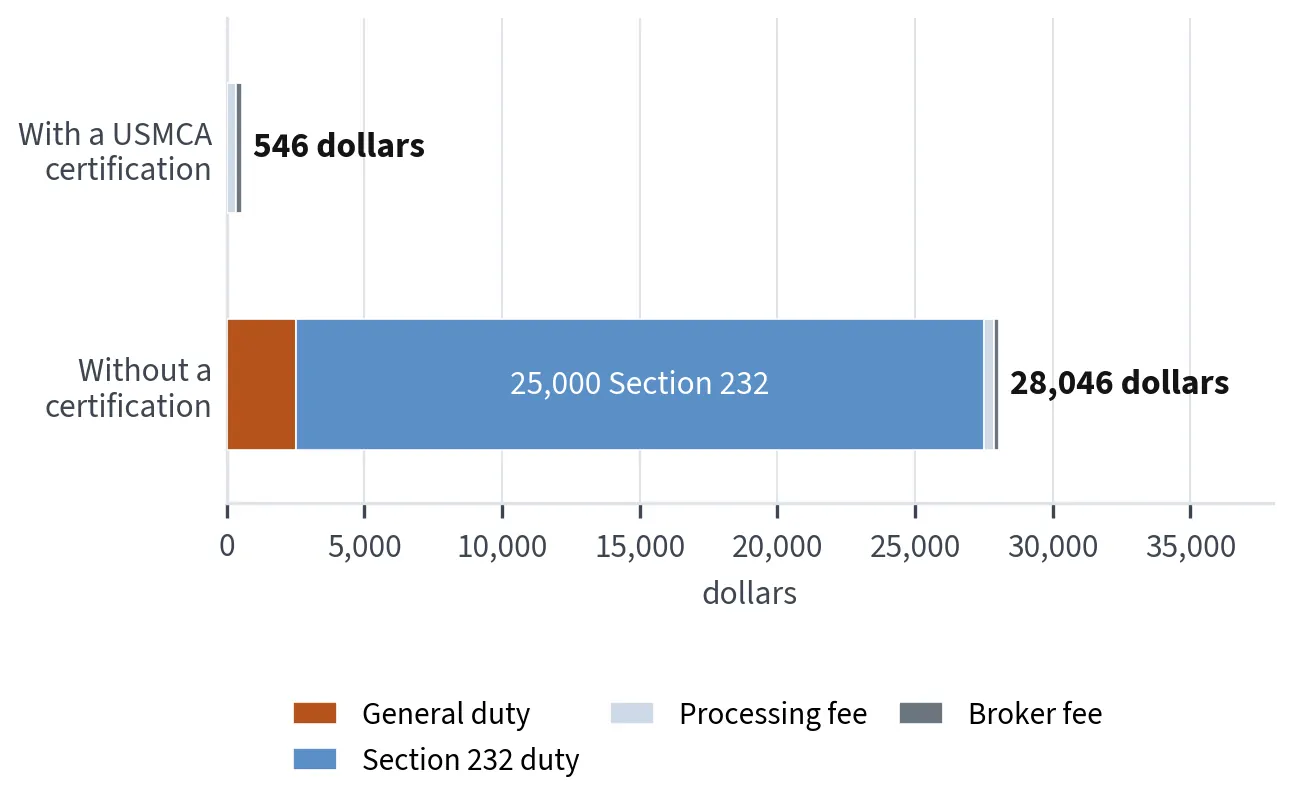
Stacked bar chart of two customs bills on a 100,000-dollar auto-parts shipment. With a USMCA certification: no duty, 346 dollars merchandise processing fee and 200 dollars broker fee, 546 dollars in all. Without it: 2,500 dollars general duty, 25,000 dollars Section 232 duty, plus the same 346 and 2
Customs cost of one 100,000-dollar auto-parts shipment, with and without a USMCA certification, 2026: Camtom's example with the Section 232 duty added.Figure 12.2Source: Camtom, March 17, 2026; Section 232 auto-parts proclamation, duty from May 3, 2025; Chapters 3 and 12 of this book.
Three 100 percent bars. Mexico supplied 20.7 percent of all American agricultural imports in 2025, all other countries 79.3 percent. Of American agricultural imports from Mexico, just over 70 percent were vegetables, fruit, beverages and distilled spirits. Of Mexico's agricultural exports, about 45.
Mexico's share of American agricultural imports, 2025, and what the United States buys from Mexico, by group.Figure 13.1Source: USDA Economic Research Service, Mexico trade and FDI page, updated April 1, 2026; Chapter 13 of this book.
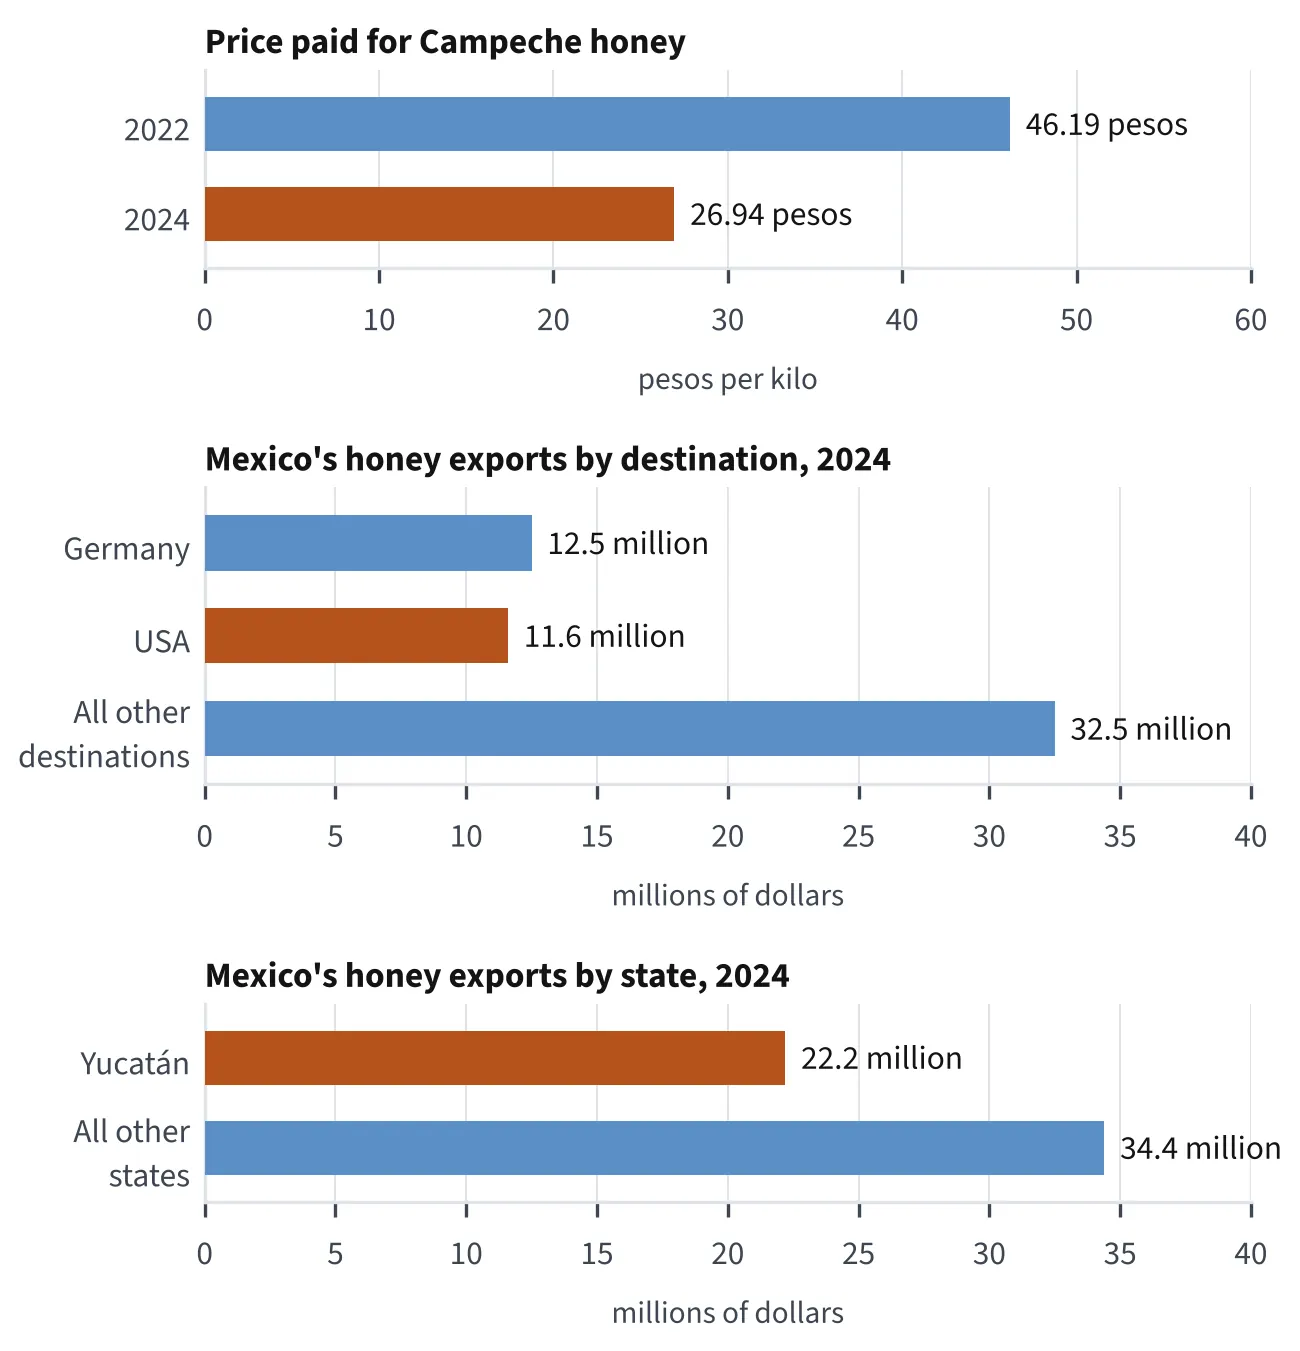
Three bar panels. Price paid for Campeche honey: 46.19 pesos a kilo in 2022, 26.94 in 2024, about 42 percent lower. Mexico's natural honey exports in 2024, 56.6 million dollars, by destination: Germany 12.5 million, USA 11.6 million, all other destinations 32.5 million. By state: Yucatán 22.2 millio
Honey: the price paid to Campeche beekeepers, 2022 and 2024, set against Mexico's honey exports by destination and by state, 2024.Figure 13.4Source: SIAP, as reported by Por Esto, September 5, 2025; DataMéxico, Secretaría de Economía, product 0409, 2024; Chapter 13 of this book.
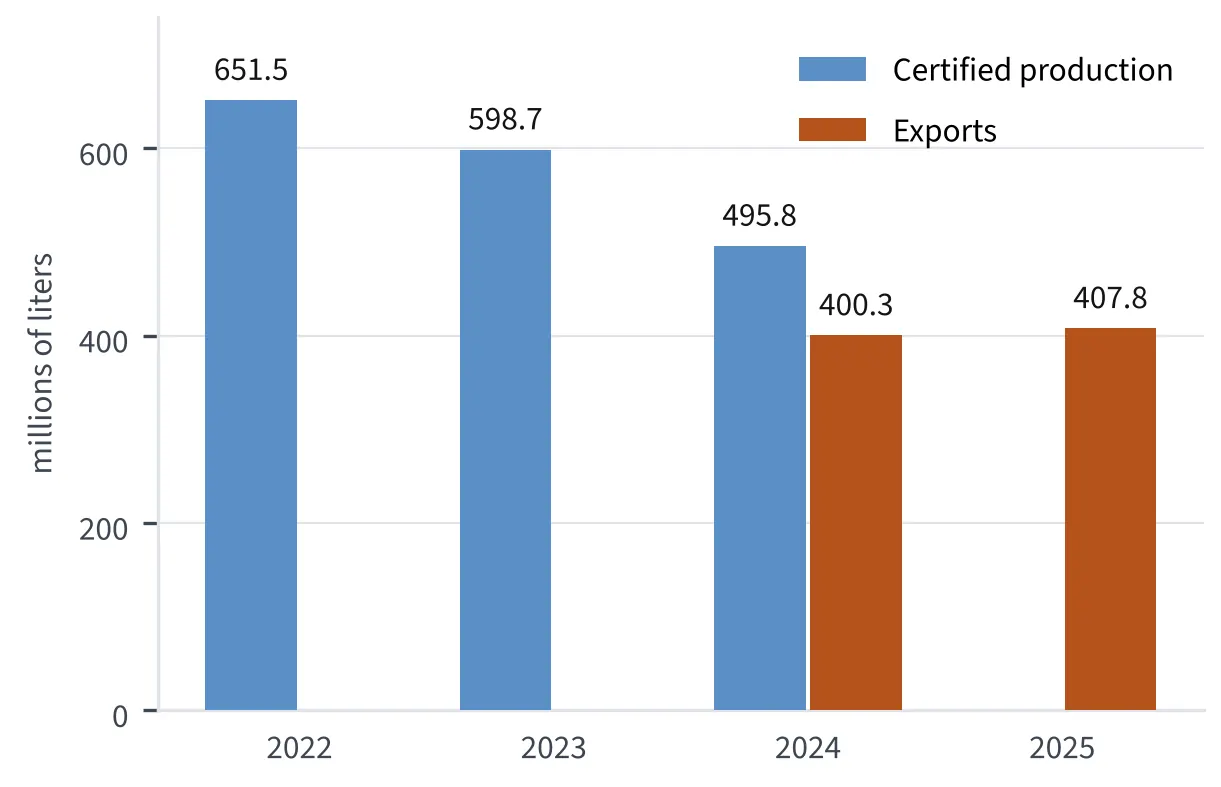
Bar chart in millions of liters. Certified tequila production: 651.5 in 2022, 598.7 in 2023 and 495.8 in 2024. Tequila exports: 400.3 in 2024 and 407.8 in 2025, of which 278.62 were 100 percent agave.
Certified tequila production, 2022 to 2024, and tequila exports, 2024 and 2025, from CRT figures as reported.Figure 14.1Source: Consejo Regulador del Tequila (CRT), as reported by Vinetur, July 30, 2026, and Líder Empresarial, February 20, 2026; Chapter 14 of this book.
Dot chart of agave prices in pesos per kilo. Growers' representatives, reported by AFP in Expansión in February 2025: up to 35 pesos at the height of the boom, about 8 pesos on average by then. IWSR, reported by The Spirits Business in April 2024: a record of 32 pesos, falling to 5 pesos by February
The price of agave: about 32 to 35 pesos a kilo at the peak, about 5 to 8 pesos in 2024 and 2025, as reported.Figure 14.2Source: Expansión (AFP), February 13, 2025; The Spirits Business, April 4, 2024, citing IWSR; Líder Empresarial, February 20, 2026, for agave used; Chapter 14 of this book.
Bar chart of Mexico's share of American toy imports: 3 percent in 2018 and 3 percent in 2022, as reported by Expansión, and a record 8.5 percent in January to July 2026, 884 million dollars, as reported by Xataka México. China's share fell from 81 to 77 percent between 2018 and 2022.
Mexico's share of American toy imports, 2018, 2022 and January to July 2026.Figure 15.2Source: Expansión, April 8, 2024; Xataka México, September 30, 2026; Chapter 15 of this book.
Horizontal bar chart of freight between the United States and Mexico in 2025 by mode: truck 642.2 billion dollars (73.6 percent), rail 94.7 billion (10.9 percent), vessel 67.4 billion (7.7 percent), air 33.2 billion (3.8 percent) and pipeline 8.4 billion (1.0 percent), of a total of 872.8 billion.
Freight between the United States and Mexico by mode of transport, 2025.Figure 16.1Source: Bureau of Transportation Statistics, TransBorder Freight Data, 2025, release of May 15, 2026; Chapter 16 of this book.
Two-panel horizontal bar chart by port of entry, 2025. Truck freight in billions of dollars: Laredo 296.2, Ysleta 112.4, Otay Mesa 58.6, Hidalgo 40.8, Nogales 25.4, Eagle Pass 10.2. Trucks entering the United States, in thousands: Laredo 2,945, Ysleta 642, Otay Mesa 990, Hidalgo 719, Nogales 409, Ea
Truck freight between the United States and Mexico by port of entry, 2025, in dollars and in trucks.Figure 16.2Source: Bureau of Transportation Statistics, TransBorder Freight Data, 2025, release of May 15, 2026, and Border Crossing Entry Data, calendar 2025, read October 13, 2026; Chapter 16 of this book.
Horizontal bar chart of container throughput in 2025, in TEU: Manzanillo 3,893,357, Lázaro Cárdenas 2,616,770 (up 9 percent), Veracruz 1,299,337, Altamira 887,101, and all other ports 833,321, of a national total of 9,529,886 TEU.
Container throughput at Mexico's leading ports, 2025.Figure 16.3Source: ASIPONA Manzanillo, January 12, 2026; SEMAR data reported by Revista TyT, January 19, 2026; ASIPONA Lázaro Cárdenas and Mexico Industry, January 19, 2026; Chapter 16 of this book.
Horizontal bar chart of Mexico's share of American imports, 2021 to 2024: celestite more than 99 percent, fluorspar 64, silver 47, scrap copper by copper content 43, gypsum 30, salt 26 (the largest single source), total gold 20, refined zinc metal 15, refined lead metal 15, iron and steel 15 (second
Mexico's share of American imports by mineral commodity, 2021-2024 (U.S. Geological Survey, 2026).Figure 17.1Source: U.S. Geological Survey, Mineral Commodity Summaries 2026; Chapter 17 of this book.
Diverging bar chart of the change in Mexican mineral output, June 2026 against June 2025: iron-ore pellets up 9.1 percent to 384,493 metric tons, copper up 1.1 percent to 42,769 tons, fluorite level at 68,930 tons, silver down 8.5 percent to 322,726 kilograms, gold down 19.2 percent to 4,917 kilogra
Mexican output of selected minerals, June 2026 against June 2025 (INEGI, August 20, 2026).Figure 17.2Source: INEGI, minerometallurgical industry, June 2026, bulletin of August 20, 2026; Chapter 17 of this book.
Bar chart in thousands of barrels a day. USA crude oil imports from Mexico, crude only, EIA: 733 in 2023, 464 in 2024 and 383 in 2025. Pemex crude exports as reported in the press: 806.1 in 2024, 580.6 in 2025, 367.8 in December 2025, 294 in January 2026 and 431.8 in January to May 2026.
American imports of crude oil from Mexico, 2023-2025 (U.S. Energy Information Administration), beside Pemex crude exports as reported in the press.Figure 17.3Source: U.S. Energy Information Administration; Argus Media, January 27, 2026; Bloomberg Línea, February 26, 2026; La República, July 3, 2026; Chapter 17 of this book.
Horizontal bar chart on a logarithmic scale of ISO 9001 certificates in 2024: China 651,851, first in the world; the United States 28,783, ninth in the world; Mexico 9,090, first in Latin America. The world total was 1,474,118.
ISO 9001 certificates in Mexico, the United States and China, ISO Survey 2024.Figure 18.1Source: ISO Survey 2024, as shown in a Global Standards infographic, October 2025, and as reported by qi-a.com, read October 12, 2026; Chapter 18 of this book.
Timeline from November 25 to December 10, 2024. One grower, Agrotato, S.A. de C.V., in Sonora. SunFed Produce recalled on November 27 and Baloian Farms on November 29; nine further recalls followed down the chain through December 9, eleven in all. The last illness began on December 7. By January 8,
The Agrotato cucumber recalls, November 27 to December 9, 2024: one grower, eleven recalls.Figure 18.2Source: U.S. Food and Drug Administration, outbreak investigation and recall list, Salmonella Typhimurium and cucumbers from Agrotato, S.A. de C.V., January 8, 2025; Chapter 18 of this book.
Four bar panels comparing fiscal 2024 with fiscal 2025, all countries of origin. Trade penalties: 2,204 to 2,432. Liquidated damages cases: 22,399 to 53,052, more than double. Intellectual property seizures: 20,516 worth an estimated $5.5 billion at retail, to 25,079 worth $7.4 billion. Shipments de
U.S. Customs and Border Protection enforcement, fiscal 2024 and fiscal 2025: trade penalties, liquidated damages cases, intellectual property seizures and forced-labor detentions.Figure 19.3Source: U.S. Customs and Border Protection data, as summarized by Air Cargo Week, April 7, 2026; Chapter 19 of this book.
Dot chart of Federal Reserve monthly average pesos per dollar: 17.0932 in January 2024; 16.7693 in March 2024, the low; 20.3381 in November 2024; 20.5367 in January 2025, the high; 18.0708 in December 2025; 17.7700 in March 2026; 17.0609 in August 2026. The mean of all monthly averages over the peri
Pesos per dollar at seven Federal Reserve monthly averages, January 2024 to August 2026.Figure 19.2Source: Federal Reserve Board, monthly average Mexican pesos per U.S. dollar, via FRED, read September 1, 2026; Chapter 19 of this book.
Grouped bar chart of American goods imports in billions of dollars. From China: 536.3 in 2022, 427.2 in 2023, 440.3 in 2024 and 308.7 in 2025. From Mexico: 472.9 in 2023, 503.1 in 2024 and 534.3 in 2025, when Mexico became the largest single source.
American goods imports from China, 2022 to 2025, and from Mexico, 2023 to 2025, Census Bureau, in billions of dollars.Figure 20.1Source: U.S. Census Bureau, Trade in Goods with China and Trade in Goods with Mexico, read October 12, 2026; Chapter 20 and Part VII of this book.
Range bar chart of months to production. Shelter: American Industries Group 90 to 120 days, about 3 to 4 months; NAPS International 3 to 4 months; Tetakawi 3 to 6 months. Own company: American Industries Group 6 to 12 months; NAPS International 9 to 12 months or more; Tetakawi 8 to 18 months. New 10
Months from decision to production: shelter, own company and new building, as stated by the firms named, 2026.Figure 21.3Source: American Industries Group, April 7 and July 24, 2026; NAPS International, February 23, 2026; Tetakawi, October 7, 2026; American Industrial Magazine, February 4, 2026; Chapter 21 of this book.

Investing in Mexico

40 figures. See the book

Two stacked horizontal bars of foreign direct investment into Mexico, in millions of dollars. 2025, total 40,871: reinvested earnings 27,650 (67.7 percent), new investment 7,378 (18.0 percent), intercompany accounts 5,844 (14.3 percent). January to June 2026, total 34,968: reinvested earnings 30,957
Foreign direct investment into Mexico by type, 2025 and the first half of 2026: reinvested earnings, new investment and intercompany accounts.Figure 1.1Source: Secretaría de Economía, preliminary, as reported by Bloomberg Línea and El CEO, February 25, 2026, and Expansión, August 24, 2026; Chapter 1 of this book.
Horizontal bar chart of yields in percent a year, in three groups. Short government bills: four-week United States Treasury bill 3.96 percent on October 9, 2026, against the 28-day Cetes at 6.13 percent on August 25, 2026. Ten-year government bonds: ten-year Treasury 5.24 percent on October 9, 2026,
What the same dollar is offered, 2026: American and Mexican bills and bonds, and FIBRA Macquarie's implied cap rate, dates differing as marked.Figure 1.2Source: U.S. Department of the Treasury, October 9, 2026; Banco de México auction results, August 25 and September 24, 2026; FIBRA Macquarie México, June 30, 2026; Chapter 1 of this book.
Line chart of the Banxico FIX in pesos per dollar at each year end: 2016, 20.6194; 2017, 19.6629; 2019, 18.8642; 2020, 19.9087; 2021, 20.4672; 2022, 19.4715; 2023, 16.919; 2024, 20.7862; 2025, 18.0012; and 18.2542 on October 12, 2026. Two single days are marked: the weakest FIX of 2020, 24.8583 on A
The peso against the dollar at the close of 2016, 2017 and each year from 2019 to 2025, and on October 12, 2026, with the weakest FIX of 2020 and the strongest of 2024.Figure 3.1Source: Banco de México, FIX; CEFP reports of July 17, 2020, and April 26, 2024; Chapter 3 of this book.
Step chart of two policy rates, in percent, from December 2023 to September 2026. Banxico held 11.25 percent to February 8, 2024; cuts began in March 2024; the rate was 10.00 percent at the end of 2024 and 7.00 percent at the end of 2025; it held at 7.00 on February 5, 2026, was cut to 6.75 on March
Banxico's policy rate and the Federal Reserve's target range, December 2023 to September 2026.Figure 3.2Source: Banco de México, policy decisions and year-end target rates as reported by CEFP; Federal Reserve Board, Open Market Operations and FOMC statement of September 16, 2026; Chapter 3 of this book.
A schematic strip across the country, from a land border on the left to a coastline and the sea on the right. Next to the border, a band 100 kilometers wide; next to the coast, a band 50 kilometers wide, drawn to the same scale. Both bands are the restricted zone, where foreigners may not acquire di
The restricted zone: one hundred kilometers from the borders and fifty from the coasts, Constitution article 27 fraction I, text in force as of October 7, 2026.Figure 6.2Source: Constitución Política de los Estados Unidos Mexicanos, article 27, fraction I, text as in force with latest reform DOF October 7, 2026; Ley de Inversión Extranjera, articles 10, 10 A, 11 and 13, DOF May 27, 2024; Chapter 6 of this book.
A cross-section of a beachfront, from left to right: the sea; the beach; then a strip of firm, passable land twenty meters wide next to the beach, the federal maritime-terrestrial zone or ZOFEMAT, which belongs to the Nation; then the private lot with a house. A dashed line marks where the federal z
From the water to the lot: beach, the twenty-meter federal maritime-terrestrial zone and private land, Ley General de Bienes Nacionales article 119, DOF November 14, 2025.Figure 6.3Source: Ley General de Bienes Nacionales, article 119, text last reformed DOF November 14, 2025; Constitución Política, article 27, fraction I; Chapter 6 of this book.
A timeline drawn to scale from 2024 to 2028. September 11, 2024: the Senate passes the judicial reform. September 15, 2024: the decree is published in the Diario Oficial and judges are to be elected. June 1, 2025: the first judicial election, for 881 federal posts. October 16, 2025: the amparo refor
The judicial reform on a timeline: Senate vote September 11, 2024, to the second judicial election, June 4, 2028.Figure 7.1Source: Diario Oficial de la Federación, September 15, 2024, and October 16, 2025; INE, June 2, 2025; N+, June 1, 2026; Chapter 7 of this book.
Dot chart of ranks among 143 countries in the World Justice Project Rule of Law Index 2025, where 1 is the strongest. Overall: the United States 27th, Mexico 121st. Civil justice: the United States 37th, Mexico 134th, with a score of 0.35. On both measures Mexico sits in the bottom fifth of the coun
Rule of law, Mexico and the United States: overall and civil justice ranks of 143 countries, World Justice Project Rule of Law Index 2025.Figure 7.2Source: World Justice Project, Rule of Law Index 2025, October 28, 2025; Chapter 7 of this book.
Horizontal bar chart of the 61 investor-state cases against Mexico listed by UNCTAD as of October 12, 2026: 25 pending, 14 decided for the State, 13 decided for the investor, 7 discontinued and 2 settled. Of the 36 concluded cases, the State won 14 and the investor 13.
Investor-state cases against Mexico by outcome: pending, decided for the State, decided for the investor, discontinued, settled; UNCTAD Investment Policy Hub, as of October 12, 2026.Figure 7.3Source: UNCTAD Investment Policy Hub, Investment Dispute Settlement Navigator, as of October 12, 2026; Chapter 7 of this book.
Stacked horizontal bar chart of foreign direct investment into Mexico split by type, as percent of each period's total. In 2024, new investments were about 8.6 percent, reinvested earnings about 77.9 percent and intercompany accounts about 13.5 percent. In 2025, new investments 18.0 percent, reinves
Who brings the money: new investments, reinvested earnings and intercompany accounts as shares of foreign direct investment, 2024, 2025 and January to June 2026.Figure 8.1Source: Secretaría de Economía, preliminary figures, via the Centro de Estudios de las Finanzas Públicas, February 26, 2025, El CEO, February 25, 2026, and Expansión, August 24, 2026; Chapter 8 of this book.
Horizontal bar chart of the three largest commodities in truck freight between the United States and Mexico in 2025, by share of value. Computer-related machinery: 29.4 percent, 189.1 billion dollars, the largest. Electrical machinery: 21.3 percent, 136.9 billion dollars. Vehicles: 12.0 percent, 77.
What crosses the border by truck: computer-related machinery, electrical machinery and vehicles as shares of USA-Mexico truck freight by value, 2025.Figure 8.2Source: Bureau of Transportation Statistics, USA-Mexico freight, May 15, 2026; Chapter 8 of this book.
Horizontal bar chart of percent changes from 2024 to 2025 in Mexico's international tourism. International visitors rose 13.6 percent, to 98,202,774. International overnight tourists rose 6.1 percent, to 47,786,706. Total spending rose 6.2 percent, to 34,991.6 million dollars. Arrivals by air fell 1
Visitors up, spending per visitor down: international visitors, tourists, arrivals by air and average spend, 2025 against 2024.Figure 8.3Source: INEGI, international travelers, February 2026; Chapter 8 of this book.
Horizontal bar chart of maximum annual tax depreciation rates in Mexico. Under article 34: buildings 5 percent a year, which takes twenty years; office furniture and equipment 10 percent; cars and freight trucks 25 percent; computers and servers 30 percent; dies, molds and tooling 35 percent. Under
Maximum annual tax depreciation by asset class, Ley del Impuesto sobre la Renta articles 34 and 35, text in force as of April 1, 2024.Figure 9.1Source: Ley del Impuesto sobre la Renta, articles 34 and 35, DOF April 1, 2024; Chapter 9 of this book.
Stacked horizontal bar chart in millions of dollars. In 2025, foreign direct investment of 40,871 million split into new investment of 7,378 million, 18 percent, up 133 percent on the year, and money from companies already in Mexico: reinvested earnings of 27,650 million and intercompany accounts of
Foreign direct investment into Mexico by type, 2025 and the first half of 2026: new investment against the money of companies already in the country.Figure 10.1Source: Secretaría de Economía, as reported by Bloomberg Línea, February 25, 2026, and Cluster Industrial, August 26, 2026; Chapters 8 and 10 of this book.
Horizontal bar chart in millions of pesos. Mexico's transaction-value threshold for merger notification was about 2,036.5 million pesos before the July 16, 2025, reform, at 18 million times the 2025 UMA. After the reform, at 16 million UMA, it was 1,810.2 million pesos under the 2025 UMA and is 1,87
Mexico's merger-notification threshold in pesos before the July 16, 2025, reform, under the 2025 UMA and under the 2026 UMA, beside the 2026 American HSR minimum converted at the FIX of October 12, 2026.Figure 10.2Source: Ley Federal de Competencia Económica, article 86, as reformed DOF July 16, 2025; Greenberg Traurig; Cuatrecasas, January 2026; Federal Trade Commission as reported by Skadden, January 2026; Banco de México, FIX, October 12, 2026; Chapter 10 of this book.
Ladder diagram of credit-rating notches from BBB+ (Baa1) down to B+ (B1), with a line under BBB minus (Baa3) marking the floor of investment grade. Sovereign Mexico: R&I BBB+ stable, May 29, 2026; S&P Global BBB negative, May 12, 2026; DBRS Morningstar BBB stable, May 1, 2026; Moody's Baa3 stable, M
Mexico's sovereign ratings by agency, with outlook and date of last action, April to May 2026, beside Pemex's ratings from Moody's (May 22, 2026), S&P Global (May 2026) and Fitch (September 2026).Figure 11.1Source: Moody's, S&P Global, Fitch, DBRS Morningstar and R&I, as relayed by SHCP and Banorte, April to May 2026; El Financiero, May 2026; El CEO, May 13 and September 25, 2026; Mexico Business News, June 5, 2026; Chapters 3 and 11 of this book.
Stacked horizontal bar chart of Mexico's total equity risk premium. January 2026, on the Baa2 rating then in force: mature-market premium 4.23 percent plus country risk premium 2.46 percent, total 6.69 percent. July 2026, after Moody's downgrade: mature-market premium 4.17 percent plus country risk
How Mexico's equity risk premium is built, January and July 2026: mature-market premium and country risk premium.Figure 11.2Source: Aswath Damodaran, NYU Stern, January 5, 2026; Elite Currensea, summary of Damodaran's data, July 2026; U.S. Department of the Treasury, daily yield curve, October 9, 2026; Chapter 11 of this book.
Two-panel chart of the peso's FIX rate. Top panel, pesos per dollar at each year end: 2016, 20.6194; 2017, 19.6629; 2018, absent from this edition's sources; 2019, 18.8642; 2020, 19.9087; 2021, 20.4672; 2022, 19.4715; 2023, 16.919; 2024, 20.7862; 2025, 18.0012; and October 9, 2026, 18.4163, marked.
The peso against the dollar at each year end, 2016 to 2025, Banxico FIX rate, with the October 9, 2026, FIX marked, and the change over each year.Figure 11.3Source: Banco de México, FIX exchange rate, year-end values 2016 to 2025 and October 9, 2026; Chapters 3 and 11 of this book.
Horizontal bar chart of foreign direct investment into Mexico in 2025 by type, in millions of dollars, out of a total of 40,871 million. New investment: 7,378 million, 18.0 percent. Reinvested earnings: 27,650 million, 67.7 percent, the largest part by far. Intercompany accounts: 5,844 million, 14.3
Foreign direct investment into Mexico by type, 2025: new investment, reinvested earnings and intercompany accounts, in millions of dollars.Figure 12.1Source: Secretaría de Economía, announcement of February 25, 2026; Chapter 12 of this book.
Horizontal bar chart of the costs three American retailers reported on leaving Mexico, in millions of dollars. Lowe's, 2018: 22 million of pre-tax impairment charges on Mexican long-lived assets, for 13 stores. Best Buy, 2020: 111 million of restructuring charges in the quarter ended October 31, 202
What leaving cost: Lowe's (2018), Best Buy (2020) and J. C. Penney (2003), charges and expected losses on exiting Mexico, in millions of dollars, from the companies' own filings.Figure 12.2Source: Lowe's, November 2018, and annual report of April 2, 2019; Best Buy, November 24, 2020, and annual report for fiscal 2021, March 2021; J. C. Penney, October 29, 2003; Chapter 12 of this book.
Two horizontal bar charts. Top, the number of listed domestic companies: Mexico 128 at the end of 2025, by the World Federation of Exchanges, against 3,908 in the United States in 2025, by the World Bank, about thirty times as many. Bottom, market capitalization of listed domestic companies as a sha
Listed domestic companies and market capitalization as a share of GDP, Mexico and the United States, 2025.Figure 13.1Source: World Bank, market capitalization and listed domestic companies, 2025, read October 12, 2026; World Federation of Exchanges, as reported; Grupo BMV, investor presentation, first quarter of 2026; Chapter 13 of this book.
Two horizontal bar charts in percent of GDP. Top, the World Bank's domestic credit to the private sector in 2024: Mexico 34.65 percent against the United States at 198 percent, almost six times as much relative to the economy. Bottom, two separate Mexican measures that are not comparable with the to
Domestic credit to the private sector as a share of GDP, Mexico and the United States, 2024, with Mexico's credit to the private sector as the ABM reports it (fourth quarter of 2025) and broader financing (first quarter of 2026) shown as separate measures.Figure 13.2Source: World Bank, domestic credit to the private sector, as republished by Trading Economics, read October 13, 2026; Bank for International Settlements data, as reported by the Asociación de Bancos de México, presentation of August 26, 2026; Bank for International Settlements, total credit statistics, read October 27, 2026; Banco de México, as reported by México, ¿cómo vamos?, read October 13, 2026; Chapter 13 of this book.
Column chart of private equity investment in Mexico in millions of dollars, by AMEXCAP's count. 2023: 2,579 million. 2024: more than 6,000 million, about 2.3 times 2023 and the third-largest amount in fifteen years; no exact figure was given, so the column is drawn to 6,000 as a floor. 2025: 5,376 m
Private equity investment in Mexico, 2023, 2024, 2025 and the first half of 2026.Figure 13.3Source: AMEXCAP, as reported by El CEO, September 5, 2025 (2023 and 2024), and by MVS Noticias and by Finanzas Digital with EFE, September 8, 2026 (2025 and January to June 2026); Chapter 13 of this book.
Horizontal bar chart of price changes in percent. Top group, the federal mortgage agency SHF's housing price index over the year to the second quarter of 2026: national 7.31 percent, Solidaridad, the municipality of Playa del Carmen, 9.96 percent, and Benito Juárez, Cancún's municipality, 9.69 perce
Two markets in one country: the SHF housing price index, national, Solidaridad and Benito Juárez, year to the second quarter of 2026, against the reported fall in Tulum condominium prices, 2023 to 2025.Figure 15.1Source: Sociedad Hipotecaria Federal, housing price index, second quarter of 2026, report of August 13, 2026; AMPI specialists, as reported by Riviera Maya News, November 29, 2025; Chapter 15 of this book.
Two parts. Top, a horizontal bar chart of Banorte's average housing prices in pesos per square meter: national average 31,016 in August 2025, housing under construction 36,372, new housing 33,670, and Yucatán 27,871 in the first quarter of 2025. Bottom, a schematic of one unit's price split into thr
What the price pays for: construction cost per square meter, the land and the premium for location and amenities, set against Banorte's average prices per square meter, 2025.Figure 15.2Source: Banorte, housing price indicator, as reported by El Heraldo de México, September 21, 2025, and Por Esto!, November 30, 2025; author's experience, recorded October 13, 2026; Chapter 15 of this book.
Two horizontal bar charts. Top, Tulum's active short-term rental listings by AirDNA's count: September 2026, 3,622 listings, which AirDNA shows as down 73 percent on September 2025; the September 2025 count is not in this edition's sources and is drawn as an empty box marked absent. Bottom, annual a
Tulum's active short-term listings, September 2025 and September 2026, against Playa del Carmen's reported appreciation.Figure 15.3Source: AirDNA, Tulum market page, updated October 6, 2026; AMPI Riviera Maya, as reported by Riviera Maya News, September 11, 2025; Chapter 15 of this book.
Diagram of five rising steps, from bottom left to top right. Step 1, stay a tourist and rent a room or a villa: the cost of each year's visit can be worked out, and in the author's view it is the right place for most people. Step 2, a timeshare: in his view a racket of the same family as network mar
The ladder a foreign buyer climbs without a mortgage: stay a tourist and rent, a timeshare, a fractional share, a pre-sale, buying outright.Figure 15.4Source: the author's own account, recorded October 14, 2026 (Questions 8 and 11); Chapters 15 and 17 of this book.
Horizontal bar chart of what four million pesos came to in dollars at each year-end FIX rate. End of 2016: about 194,000 dollars at 20.6194 pesos per dollar. 2017: about 203,400 at 19.6629. 2018: absent, not in this edition's sources. 2019: about 212,000 at 18.8642. 2020: about 200,900 at 19.9087. 2
Four million pesos in dollars at each year-end FIX rate, 2016 to 2025.Figure 15.5Source: Banco de México, FIX exchange rate, year-end values 2016 to 2025; Chapters 3 and 15 of this book.
Diagram of the parties to a restricted-zone bank trust. At the top, the Foreign Ministry (SRE) issues a permit, under article 11, allowing a Mexican bank to hold a property in the restricted zone; it decides within five business days of an electronic filing, under article 14. The trustee bank holds
Who holds what in a restricted-zone trust: the SRE permit, the trustee bank holding title, the foreign beneficiary holding use and income, the substitute beneficiaries named in the permit, and the notary's deed.Figure 16.1Source: Ley de Inversión Extranjera, articles 2 fraction VI and 11 to 14, DOF May 27, 2024; Secretaría de Relaciones Exteriores, trust permit and "Costos y Tiempos" pages, updated September 21, 2026; Chapter 16 of this book.
Two horizontal bar charts of the cost of a restricted-zone trust in pesos before IVA. Top, ten-year totals by bank from a vendor's 2026 tables: Scotiabank 155,000, HSBC 170,000, Banorte 178,000, Santander 197,000, BBVA 215,000 and Banamex 238,000, a spread of 83,000 pesos. Bottom, an illustrative fi
The cost of a trust over fifty years, illustrative: government fees, bank setup and annual fees by bank, and the effect of the bank chosen on the total, 2026.Figure 16.2Source: Secretaría de Relaciones Exteriores, "Costos y Tiempos", updated September 21, 2026; mortgage-comparison vendor tables of trust fees by bank, 2026; Tandacasa, June 2026; Chapter 16 of this book.
Flow diagram of a short-term rental payment. The guest pays the platform. The platform pays the host, withholds income tax from what it pays and files the withholdings with the SAT, under article 113-A of the Income Tax Law. From April 1, 2026, the platform must also give the SAT permanent online ac
From the guest's payment to the SAT: platform withholding, the non-resident's 25 percent on gross rent, the platform's permanent online data access from April 1, 2026, and the state's host register in Quintana Roo.Figure 16.3Source: Ley del Impuesto sobre la Renta, articles 113-A and 158, compilation text accessed October 13, 2026; Código Fiscal de la Federación, article 30-B, as reported by El CEO, March 30, 2026, and Alegra, April 1, 2026; Ley del Impuesto al Hospedaje del Estado de Quintana Roo, as reformed December 16, 2025; SAT, Plan Maestro 2024; Chapter 16 of this book.
Two-column flow diagram of what happens to a trust when the beneficiary dies. Left, substitute beneficiaries named in the permit: they present the death certificate, apostilled and translated, to the trustee bank; the bank obtains the change before the SRE; there is no Mexican probate, and the right
When the beneficiary dies: substitute beneficiaries named, documents to the bank, SRE change, no probate; against no designation, a Mexican succession, acquisition tax and a year or more.Figure 16.4Source: Ley de Inversión Extranjera; American Bar Association, Probate and Property, May-June 2026; Infobae México, July 9, 2026; Ley del Impuesto sobre la Renta, article 93 fraction XXII; Quintana Roo acquisition-tax law, articles 8 and 9; Chapter 16 of this book.
Diagram in two parts. Above, three levels of inspection as rising steps. Level 1, visual: a walk-through with a list of what can be seen. Level 2, functional: everything that runs is tested, the washing machine run and the hot water left on for twenty minutes. Level 3, structural: pilot holes drille
Three levels of inspection: visual walk-through and list; functional test of every system; structural, with core tests, plans, foundation and rebar checked against the plans. Where the problems are found: about 60 percent in the paperwork.Figure 17.3Source: the author's own account, recorded October 14, 2026; Chapter 17 of this book.
Horizontal bar chart of sargassum removed in Quintana Roo, January to August of each year, in tonnes: 2022, 65,646; 2023, 51,309; 2024, 40,992; 2025, 73,224, of which Playa del Carmen 28,605; 2026, 121,110, of which Playa del Carmen 41,307. Outlines extend 2025 to its full-year count of 92,782 tonne
Sargassum removed in Quintana Roo, 2022 to 2026, with Playa del Carmen's share and the Navy's 2026 plan.Figure 18.3Source: Riviera Maya News, September 2, 2025 and September 3 and 9, 2026, reporting state and Navy counts; Por Esto!, October 1, 2026; Mexico News Daily, July 30, 2026; Chapter 18 of this book.
Vertical timeline of seven hurricanes that came ashore on the Quintana Roo coast from 2005 to 2024. Emily, July 18, 2005, near Tulum, Category 4. Wilma, October 21, 2005, on Cozumel and then the mainland near Puerto Morelos, winds near 130 knots. Dean, August 21, 2007, the southern coast, Category 5
Hurricanes that came ashore on the Quintana Roo coast, 2005 to 2024.Figure 18.4Source: U.S. National Hurricane Center, tropical cyclone reports on Wilma and Emily (2005) and Beryl (2024); Quintana Roo, Atlas de Riesgos 2023; Wikipedia entries on hurricanes Dean, Delta, Zeta and Grace, accessed October 2026; Chapter 18 of this book.
A five-step flow from top to bottom. Step 1, land use: what the land may be used for, such as Mérida's land-use license, the first step toward a construction license. Step 2, environmental authorization from SEMARNAT under LGEEPA article 28, only where the law requires it, for developments that affe
From lot to license on the coast: land use, environmental authorization where the law requires it, the perito's signature, the construction license, and the IMSS registration of the work within five business days of the start, 2026.Figure 19B.1Source: Municipio de Mérida, form F-DEU/USS-01; Municipio de Tulum, Reglamento de Construcción and construction-license requirements, accessed October 2026; LGEEPA articles 3 and 28 and its environmental-impact regulation, article 5; Reglamento del Seguro Social Obligatorio para los Trabajadores de la Construcción, articles 4, 5 and 12; Chapter 19B of this book.
Grouped bar chart of the labor the IMSS presumes a house carries, in pesos, for three home types at three sizes, by this book's arithmetic on the 2026 rates. At 100 square meters: social-interest home 128,300 pesos, medium-type 152,300, luxury 199,100. At 200 square meters: 256,600, 304,600 and 398,
What the IMSS presumes a house carries in labor, 2026: social-interest, medium and luxury homes at 100, 200 and 300 square meters.Figure 19B.2Source: IMSS Technical Council agreement ACDO.AS2.HCT.270126/9.P.DIR, DOF February 6, 2026; Reglamento del Seguro Social Obligatorio para los Trabajadores de la Construcción, article 18; Chapter 19B of this book.
A vertical timeline of the USMCA's calendar, not to scale. July 1, 2020: entry into force for sixteen years. July 1, 2026: the joint review in the sixth year; the United States does not confirm, so there is no renewal and the agreement stays in force in its annual phase. October 2, 2026: USTR opens
The agreement's calendar: entry into force July 1, 2020; joint review July 1, 2026 without renewal; comments for the 2027 review due January 12, 2027; annual reviews to expiry on July 1, 2036, or a written extension by all three for another sixteen years.Figure 21.1Source: USMCA Articles 34.6 and 34.7, in force July 1, 2020; USTR, July 1 and October 2, 2026; White & Case, July 2, 2026; Chapter 21 of this book.
Bar chart of the share of American imports from Mexico entering under a claimed USMCA preference: 44.8 percent in January 2025, 86.1 percent in July 2025 and 88.7 percent in November 2025. The share nearly doubled within the year, after the 2025 tariffs exempted goods that qualify under the agreemen
Share of American imports from Mexico claiming USMCA preference: January, July and November 2025.Figure 21.2Source: U.S. Census Bureau data, as reported February 10, 2026; Chapter 21 of this book.
Dot chart of forecasts of Mexico's real GDP growth, in percent, for 2026 and for 2027. IMF, July 2026: 1.2 and 1.9. World Bank, October 6, 2026: 1.4 and 1.8. OECD, September 23, 2026: 1.5 and 1.8. Banco de México quarterly report, August 26, 2026: 1.5 and 2.0. Banxico survey of private analysts, pub
Forecasts of Mexico's real GDP growth for 2026 and 2027, by body and date, July to October 2026.Figure 21.3Source: IMF, World Economic Outlook Update, July 2026; World Bank, Mexico country overview, October 6, 2026; OECD, Interim Economic Outlook, September 23, 2026; Banco de México, Informe Trimestral April to June 2026 and Encuesta sobre las Expectativas, September 2026, as reported; SHCP, Criterios Generales de Política Económica 2027, September 8, 2026, as reported; Chapter 21 of this book.

Where to Go in Mexico

34 figures. See the book

Bar chart of output per person in 2024 for the 32 entities, from Campeche at 461,400 pesos and Mexico City at 450,300 down to Guerrero at 84,600 and Chiapas at 67,200, against a national 192,800.
Output per person by state, 2024, in thousands of constant 2018 pesos, all 32 entities ranked, with the national figure marked.Figure 1.1Source: Comité Estatal de Información Estadística y Geográfica de Chiapas, calculation from INEGI preliminary state GDP for 2024 (base 2018, published December 5, 2025) and CONAPO population projections; Chapter 1 of this book.
Diverging bar chart of each entity's move in IMCO's 2026 index: Quintana Roo up twelve places to 9th, Nayarit up eight to 14th, Campeche up six to 13th, Chiapas up five to 27th, Querétaro up four to 2nd; Chihuahua, Hidalgo and Sinaloa down seven each to 15th, 21st and 23rd, Baja California down six
The 32 entities in IMCO's State Competitiveness Index, 2026 edition (September 2026), with each entity's move against the 2025 edition.Figure 2.2Source: IMCO, Índice de Competitividad Estatal 2026, published September 21, 2026, and Índice de Competitividad Estatal 2025, June 2025; Chapter 2 of this book.
Paired bar chart of IMMEX shares. July 2026: Baja California 17.3 percent of establishments and 11.9 of employment, Nuevo León 13.8 and 13.7, Chihuahua 9.3 and 12.0, down to Tamaulipas 6.2 and 7.4. June 2024: nineteen states, from Baja California 17.6 and 12.2 to Mexico City 2.2 and 1.3 and Michoacá
IMMEX establishments and employment by state: shares of the seven leading states, July 2026, and of the nineteen states in INEGI's June 2024 table (INEGI, September 23, 2026 and August 21, 2024).Figure 3.1Source: INEGI, Estadística Mensual del Programa IMMEX, July 2026, published September 23, 2026; INEGI, IMMEX establishment indicators, June 2024, published August 21, 2024; Chapter 3 of this book.
Bar chart of exports by state in the second quarter of 2026, from Chihuahua at 49,027.5 million dollars (up 87.3 percent) and Jalisco at 23,585.1 million (up 130.8 percent) down to Quintana Roo at 2.0 million, with each state's change on a year earlier and manufacturing share.
Exports by state of origin, second quarter of 2026, the 32 federal entities ranked, with the change on a year earlier and the manufacturing share (INEGI, ETEF, September 30, 2026).Figure 3.2Source: INEGI, Exportaciones Trimestrales por Entidad Federativa, second quarter of 2026, bulletin 609/26, September 30, 2026; Chapter 3 of this book.
Bar chart of 2025 foreign direct investment by entity: Mexico City 22,381.3 million dollars, Nuevo León 3,627.6, Estado de México 3,279.3, Baja California 1,892.3, down to net outflows in Campeche, Durango, Veracruz, Tabasco and Aguascalientes, the last at minus 334.1 million.
Foreign direct investment by destination state, the 32 federal entities ranked, 2025 (Secretaría de Economía, published April 14, 2026).Figure 3.3Source: Secretaría de Economía (RNIE), foreign direct investment by state of destination, 2025, as reproduced in the Gaceta Parlamentaria of the Cámara de Diputados, published April 14, 2026; Chapter 3 of this book.
Two bar charts: informality ranges from 34.8 percent in Nuevo León to 80.1 percent in Oaxaca against 55.1 percent nationally, while unemployment ranges from 0.8 percent in Oaxaca to 4.2 percent in Mexico City against 2.7 percent nationally.
Informality in sixteen federal entities and unemployment in twelve, second quarter of 2026 (INEGI, ENOE).Figure 4.1Source: INEGI, Encuesta Nacional de Ocupación y Empleo (ENOE), second quarter of 2026, bulletin 503/26, published August 25, 2026; Chapter 4 of this book.
Bar chart of the average daily IMSS contribution wage in July 2026 for all 32 entities, from 800.44 pesos in Mexico City and 745.78 in Baja California down to 538.70 in Nayarit, beside a national average of 669.1 pesos at the end of June 2026.
Average daily IMSS contribution wage, 32 federal entities, July 2026 (IMSS open data processed by Lokus Data).Figure 4.2Source: IMSS open data processed by Lokus Data, July 2026; IMSS, national average contribution wage, end of June 2026; Chapter 4 of this book.
Bar chart of the change in formal jobs from July 2025 to July 2026 for all 32 entities, from plus 7.0 percent in Baja California and 5.8 in Oaxaca to minus 2.5 in Tamaulipas and minus 7.3 in Campeche, beside a national 1.5 percent in the year to May 2026.
Annual change in IMSS-registered formal jobs, 32 federal entities, July 2025 to July 2026 (IMSS open data processed by Lokus Data).Figure 4.3Source: IMSS open data processed by Lokus Data, July 2026; IMSS, national formal jobs at May 31, 2026; Chapter 4 of this book.
Bar chart of all 32 entities in 2023: crimes per 10,000 economic units range from 13,700 in Sonora and 11,661 in Querétaro to 3,020 in Tamaulipas, against 6,114 nationally; victimized units per 10,000 range from 3,728 in Sonora to 1,756 in Tamaulipas, against 2,722 nationally.
Crimes per 10,000 economic units and victimized units per 10,000, the 32 federal entities, 2023 (INEGI, ENVE 2024).Figure 5.1Source: INEGI, Encuesta Nacional de Victimización de Empresas (ENVE) 2024, reference year 2023, published December 10, 2024, state incidence and prevalence tables; Chapter 5 of this book.
Paired bar chart: businesses victimized range from 3,728 per 10,000 units in Sonora to 1,756 in Tamaulipas, against 2,722 nationally; adults victimized, for 21 entities, range from 34,851 per 100,000 in the Estado de México to 15,576 in Chiapas, against 24,135 nationally.
Businesses victimized per 10,000 units (ENVE 2024, year 2023), the 32 federal entities ranked, and adults victimized per 100,000 (ENVIPE 2025, year 2024) for 21 of them, INEGI.Figure 5.2Source: INEGI, Encuesta Nacional de Victimización de Empresas (ENVE) 2024, reference year 2023, published December 10, 2024; INEGI, Encuesta Nacional de Victimización y Percepción sobre Seguridad Pública (ENVIPE) 2025, reference year 2024, published September 18, 2025, and ENVIPE 2026, published September 10, 2026; Chapter 5 of this book.
Bar chart of eleven cities in June 2026: Villahermosa 84.2 percent, Guadalajara 78.0, León 70.8, Tuxtla Gutiérrez 70.6, Cancún 70.1, Tijuana 67.6, Ciudad Juárez 63.7, Monterrey 57.2, Mérida 38.2, Querétaro 36.1 and Saltillo 16.9, against an urban average of 59.8.
Adults who feel unsafe in their city, selected metros, June 2026 (ENSU), INEGI.Figure 5.3Source: INEGI, Encuesta Nacional de Seguridad Pública Urbana (ENSU), June 2026, published July 24, 2026; Chapter 5 of this book.
Bar chart of the 2026 Peace Index for all 32 entities, from Yucatán, most peaceful at 1.279, Chiapas 1.708 and Tlaxcala 1.728 to Sinaloa 4.364 and Colima, least peaceful at 4.579, against a national score of 2.814.
Mexico Peace Index 2026 score, the 32 federal entities ranked (lower is more peaceful), Institute for Economics and Peace, May 2026.Figure 5.4Source: Institute for Economics and Peace, Mexico Peace Index 2026, May 2026; Chapter 5 of this book.
Horizontal bars of 2025 reserve margins: Baja California 16.96 percent, Baja California Sur 11.82, Yucatán Peninsula 10.1, national interconnected system 9.69, all above the 6 percent alert and 3 percent emergency lines.
Operating reserve margin at each region's 2025 peak demand, against CENACE's alert (6 percent) and emergency (3 percent) thresholds.Figure 6.1Source: CFE and CENACE via Crónica, July 14, 2025; CENACE thresholds, as consulted May 2024; Chapter 6 of this book.
Grouped bars of the March 2026 GDMTH energy charge for ten tariff regions: Peninsular highest at 1.0416 base, 1.8867 intermediate and 2.1279 peak pesos per kWh; Baja California lowest at 0.4183, 0.7573 and 1.0904.
CFE GDMTH energy charge by tariff region and time of day, March 2026, pesos per kilowatt-hour.Figure 6.3Source: CNE and CFE, GDMTH final tariffs, DOF March 2, 2026; Chapter 6 of this book.
Three bars for 653 aquifers in 2023: 114 overexploited (107 of them without availability), 179 not overexploited but without availability, and 360 with availability.
Mexico's 653 aquifers by status, 2023: overexploited, without availability, with availability (CONAGUA, as reported March 2024 and January 2026).Figure 7.1Source: CONAGUA via Excélsior, March 22, 2024; CONAGUA via Expansión, January 25, 2026; Chapter 7 of this book.
Bars extending left of zero: Área Metropolitana de Monterrey minus 12.4, Valle de Juárez minus 73.3 and Conejos-Médanos minus 90.4 million cubic meters a year.
Groundwater availability of named industrial aquifers, 2024, in million cubic meters a year: Área Metropolitana de Monterrey, Valle de Juárez, Conejos-Médanos (CONAGUA availability sheets, 2024).Figure 7.2Source: CONAGUA availability sheets 1906, 0833 and 0823, 2024; Chapter 7 of this book.
Two bar panels. Rent: Mexico City 9.93, Monterrey 7.00, Saltillo 6.87, Reynosa 6.50, Bajío 5.75, Guanajuato 5.44 and Hidalgo 5 to 6 dollars per square meter a month. Vacancy: Aguascalientes 1.9 percent, Guanajuato 2.7, Saltillo 3.8, Bajío 4.1, Mexico City 5.1, Guadalajara 6.0, Querétaro 6.1, Reynosa
Asking rent and vacancy by market, latest dated figure for each, 2025 to 2026 (USD per m2 per month; vacancy and availability marked separately; source and date under each bar).Figure 8.1Source: CBRE, first quarter and second quarter 2026; Cluster Industrial, April 15, 2026; Newmark, fourth quarter 2025; Cushman & Wakefield via El Financiero, July 28, 2026; Solili via Líder Empresarial, September 29, 2026; Accumin Intelligence, December 2, 2025; Chapter 8 of this book.
Horizontal bars of 2025 incoming truck crossings: Laredo 2,945,388, Otay Mesa 990,111, Hidalgo 719,184, Ysleta 641,729, Calexico East 446,835, Nogales 408,584, Eagle Pass 368,985, Brownsville 306,858, and all other ports 761,641, of 7,589,315 in all.
Incoming truck crossings from Mexico by USA port of entry, 2025 (USA Bureau of Transportation Statistics).Figure 9.2Source: USA Bureau of Transportation Statistics, border crossing data, 2025; Chapter 9 of this book.
Horizontal bars of 2025 container traffic: Manzanillo 3,893,357 TEU (down 0.8 percent), Lázaro Cárdenas 2,616,770 (up about 9 percent), Veracruz 1,299,337 (down 0.2), Altamira 887,101 (down 3.5), Ensenada 427,499 (down 1.7) and all other ports 405,822, of a national 9,529,886 (up 1.6 percent).
Mexico's container ports, 2025: TEU and change on 2024 (Manzanillo, Lázaro Cárdenas, Veracruz, Altamira, Ensenada; national total 9,529,886).Figure 9.3Source: SEMAR and ASIPONA data via Revista TyT, January 19, 2026; PortalPortuario, January 20, 2026; ASIPONA Manzanillo, January 12, 2026; Chapter 9 of this book.
Horizontal bar chart of the 2026 state payroll tax: Baja California highest headline rate at 4.25 percent; Mexico City and Quintana Roo 4.0; Chihuahua 4.0, about 4.69 with its surcharges, above Baja California; Yucatán 3.75; Zacatecas 3.5; Tabasco 3.5 in the El Contribuyente table, 3.0 and 3.5 in BH
State payroll tax (ISN) by federal entity, 2026, ranked; rates confirmed in state law or the state's own guide marked (Quintana Roo, Chihuahua, Yucatán), all others from compiled tables, January and February 2026.Figure 10.1Source: El Contribuyente, compiled 2026 table and February 2026; BHR, bulletin on local taxes, January 2026; SATFacil, 2026 table; Ley del Impuesto sobre Nóminas del Estado de Quintana Roo, December 16, 2025; Secretaría de Hacienda de Chihuahua, Guía Nóminas 2026; Gobierno de Yucatán, 2026; Chapter 10 of this book.
Horizontal bar chart of tropical-cyclone impacts, 1970 to 2015: Baja California Sur 44, Sinaloa 41, Quintana Roo 39, Veracruz 37, Tamaulipas 34, Michoacán and Jalisco 30, Colima and Guerrero 27, Campeche and Chiapas 24, Yucatán and Oaxaca 21, Sonora and Nayarit 20.
Tropical-cyclone impacts by state, 1970 to 2015, fifteen states ranked (Marsh, July 2016, listing SMN among its sources).Figure 11.2Source: Marsh, Hurricane Season Report for Mexico, July 2016, which lists SMN among its sources; SMN via UnoTV, May 16, 2025; CONAGUA via TV Azteca, July 8, 2026; Chapter 11 of this book.
Two bar charts. Insured loss from Hurricane Otis rose from 11,424 million pesos on November 17, 2023, to 28,103 million at the end of November, about 30,622 million in January 2024 and about 38,000 million in April 2024. In dollars, the April 2024 insured loss of 1,800 to 2,000 million compares with
Hurricane Otis, insured loss reported by AMIS over time, November 2023 to April 2024, against the estimated total damage (AMIS via La Razón, Integralia and Reforma; Enki Research via Integralia, March 2024).Figure 11.3Source: AMIS, November 17, 2023; AMIS via La Razón, November 30, 2023; AMIS via Integralia, January 2024; AMIS via Reforma and Vanguardia, April 10, 2024; Enki Research via Integralia, A 100 días del paso de Otis en Acapulco, March 2024; Chapter 11 of this book.
Paired bar chart of heat deaths by state. 2023 season to June 24: Nuevo León 64, Tamaulipas 19, Veracruz 15, Tabasco 5, Oaxaca 4, Quintana Roo and Sonora 2, Campeche 1. 2024 season to May 21: Veracruz 14, Tabasco and San Luis Potosí 8, Tamaulipas 5, Oaxaca 4, Nuevo León 3, Hidalgo 2, and one each in
Heat-related deaths by state, 2023 season to June 24 and 2024 season to May 21 (Secretaría de Salud, June 2023; Secretaría de Salud via UnoTV, May 2024).Figure 11.4Source: Secretaría de Salud, Temperaturas Naturales Extremas bulletin, June 26, 2023; Secretaría de Salud via UnoTV, May 25, 2024; Chapter 11 of this book.
Horizontal bar chart of delivered cost per unit to Dallas. Own company with IMMEX: Monterrey 49.12 dollars, Querétaro 50.92, Mérida 52.10. Shelter: 50.57, 52.37, 53.55. Contract manufacturer: 56.48, 58.55, 59.91. Plant in Texas or Ohio 62.05. China landed 53.66.
Delivered cost per unit to Dallas by origin and route, 2026: Monterrey, Querétaro and Mérida (own company with IMMEX, shelter, contract manufacturer), a plant in Texas or Ohio, and China landed (cost model of Making It in Mexico, Book 3, October 15, 2026, with state wages of July 2026 and the duties in force in October 2026; illustrative appliance, an electric fan; shelter and contract-manufacturer margins assumed).Figure 12.1Source: Connected Continents Press, the cost model of Making It in Mexico, Book 3, October 15, 2026; duties: CBP CSMS #69326983, July 23, 2026; Chapter 12 of this book.
Two bar charts. Asking rent, dollars per square meter a month: Monterrey 7.00, Ciudad Juárez 6.89, Saltillo 6.87, Chihuahua 6.57, Reynosa 6.53. Vacancy: Monterrey 6.9 percent, Ciudad Juárez 6.9, Reynosa 6.5, Chihuahua 5.5, Saltillo 3.8.
Industrial rent and vacancy in the Texas-facing North, latest dated figure for each market: Monterrey, Saltillo, Ciudad Juárez, Chihuahua, Reynosa (CBRE, Cluster Industrial, Datoz via American Industries, Newmark; fourth quarter 2025 to second quarter 2026; units converted to dollars per square meter a month and marked).Figure 13.2Source: CBRE via Cluster Industrial, May 4, 2026; Cluster Industrial, Saltillo, April 15, 2026; Datoz via American Industries Group, June 29, 2026; CBRE, Ciudad Juárez industrial, second quarter of 2026; Newmark, Reynosa, fourth quarter of 2025; Chapter 13 of this book.
Bar chart of Tijuana monthly turnover as reported: INDEX 5 to 6 percent in 2016; Tetakawi 13 percent and 12 to 16 percent in 2020; El Colegio de la Frontera Norte a 5 percent peak and 3.3 percent settled in 2025; ARHITAC 1.2 to 1.9 percent voluntary and 1.5 to 2 percent in 2026.
Monthly staff turnover in Tijuana industry as reported, 2016 to 2026, by source and date (INDEX, Tetakawi, El Colegio de la Frontera Norte, ARHITAC).Figure 14.2Source: INDEX Tijuana, September 13, 2016; Tetakawi, October 1 and December 10, 2020; El Colegio de la Frontera Norte, March 27, 2025; ARHITAC, June 8 and July 12, 2026; Chapter 14 of this book.
Two bar charts. Businesses victimized per 10,000 units in 2023: Aguascalientes 3,638, Querétaro 3,462, San Luis Potosí 3,283, Guanajuato 3,128, Zacatecas 2,912, national 2,722, Durango 2,641. Crimes per 10,000 units: Querétaro 11,661, San Luis Potosí 9,405, Aguascalientes 7,957, Zacatecas 7,186, Gua
Businesses victimized and crimes per 10,000 economic units, six corridor states and national, 2023 (INEGI, ENVE 2024), with Peace Index rank (2026) and USA advisory level (May 2026).Figure 15.2Source: INEGI, ENVE 2024 (December 10, 2024); Institute for Economics and Peace, Mexico Peace Index 2026 (May 2026); USA Department of State, travel advisory, May 29, 2026; Chapter 15 of this book.
Grouped bar chart of Bajío GDMTH energy charges in pesos per kilowatt-hour: March 2026 base 0.8622, intermediate 1.6825, peak 1.9441; September 2026 (Querétaro) base 1.0228, intermediate 1.8107, peak 2.062.
CFE GDMTH energy charges in the Bajío division by period, March and September 2026 (CFE).Figure 15.3Source: CFE, GDMTH tariffs, Bajío division, March and September 2026; Chapter 15 of this book.
Two bar charts. Vacancy, first quarter 2026, Cluster Industrial and Datoz Class A: Querétaro 6.1 and 6.6 percent, Guanajuato 2.7 and 3.9, Aguascalientes 1.9 and 1.1, Bajío region 4.1 (Cluster). Asking rent, dollars per square meter a month: Datoz Class A Querétaro 6.03, Guanajuato 5.49, Aguascalient
Industrial vacancy and asking rent by Bajío market, first quarter of 2026 (Cluster Industrial; Datoz via American Industries Group).Figure 15.4Source: Cluster Industrial, April 15, 2026; Datoz via American Industries Group, June 29, 2026; Chapter 15 of this book.
Bar chart of Guadalajara industrial vacancy as reported: about 1.2 percent for 2025 (creator source, December 2025), 2 to 4 percent for Jalisco (APIEJ, April 2026), 4.3 percent Class A in the first quarter of 2026 (Datoz) and 6.0 percent in the second quarter of 2026 (CBRE).
Guadalajara industrial vacancy as reported, by source and date, 2025 to second quarter 2026 (creator source, APIEJ, Datoz, CBRE).Figure 17.2Source: creator source, December 9, 2025; Bruno Martínez, APIEJ, VAT Noticias, April 27, 2026; Datoz via American Industries Group, June 29, 2026; CBRE Market View, second quarter 2026, via MexicoIndustry, July 30, 2026; Chapter 17 of this book.
Six small bar charts: poverty in 2024 was 58.1 percent in Guerrero, 66.0 in Chiapas and 51.6 in Oaxaca against 29.6 nationally (2022, CONEVAL: 60.4, 67.4, 58.4 and 36.3); informality in the first quarter of 2026 was 76.4, 75.3 and about 80 against 54.8; output per hour 109, 92 and 135 pesos against
Guerrero, Chiapas and Oaxaca against the national figure: poverty 2022 and 2024, informality in the first quarter of 2026, output per hour worked, formal jobs and foreign investment in 2025.Figure 20.1Source: INEGI, Pobreza multidimensional 2024, August 13, 2025, via Uno TV; CONEVAL, Medición de la pobreza 2022, August 10, 2023; INEGI, ENOE, first quarter of 2026, via Secretaría de Economía, Data México, and México ¿cómo vamos?; México ¿cómo vamos?, Semáforos estatales, first quarter of 2026; Lokus Data processing of IMSS open data, July 2026; Secretaría de Economía, RNIE, 2025; Chapter 20 of this book.
Grouped bar chart of second-quarter 2026 exports: North led by Chihuahua at 49,027.5 million dollars (up 87.3 percent), Bajío by Guanajuato at 10,163.2 million, Center and West by Jalisco at 23,585.1 million (up 130.8 percent), and South by Tabasco at 1,962.7 million, with Quintana Roo lowest at 2.0
Exports by state, second quarter of 2026, in millions of dollars, with the change from a year earlier and the manufacturing share, the 32 entities grouped as North, Bajío and center-north, Center and West, and South.Figure 21.1Source: INEGI, Exportaciones trimestrales por entidad federativa, second quarter of 2026, bulletin 609/26, September 30, 2026; Chapter 21 of this book.
Dot chart of the 32 entities ranked on construction permits, from Colima first to Mexico City 32nd, with each state's property-registration rank beside it (Querétaro 26th and 2nd, Nuevo León 27th and 6th, Yucatán 16th and 24th), and IMCO's 2025 regulatory improvement score for eight states, from Pue
Construction-permit and property-registration ranks by state, World Bank 2016 subnational study, with IMCO's 2025 regulatory improvement score for the eight states whose score is on record.Figure 23.1Source: World Bank, Doing Business en México 2016; IMCO, Índice de Competitividad Estatal 2025; Chapter 23 of this book.
Bar chart of the share of adults who feel unsafe, June 2026: from San Pedro Garza García at 10.6 percent, Piedras Negras 13.9 and Saltillo 16.9, through Querétaro 36.1, Mérida 38.2 and Monterrey 57.2, to Villahermosa 84.2 and Irapuato 91.2, against an urban average of 59.8.
Share of adults who feel unsafe in their city, June 2026: the plant cities of this book and the lowest and highest of the 91 urban areas in INEGI's survey, against the urban average.Figure 24.1Source: INEGI, Encuesta Nacional de Seguridad Pública Urbana, June 2026, published July 24, 2026; Chapter 24 of this book.

The data tables read best in the book, where they're complete; this page carries the charts and maps. Short quotations of a figure with credit are welcome; for anything more, write to us through bulk orders.

Median age

Years

Mexico, 202029Mexico, 202532United States39.4
Source: INEGI, September 22, 2026 (Mexico); US Census Bureau, Vintage 2025 (United States). More dated data: rutanamex.com.